Accessibility Settings

color options

monochrome muted color dark

reading tools

isolation ruler

Tag

pandemic

40 posts

Data Journalism

Data Journalism Top 10: Pandemic Cocktails, Pricey Food, Zoonotic Diseases, the World’s Top Songs

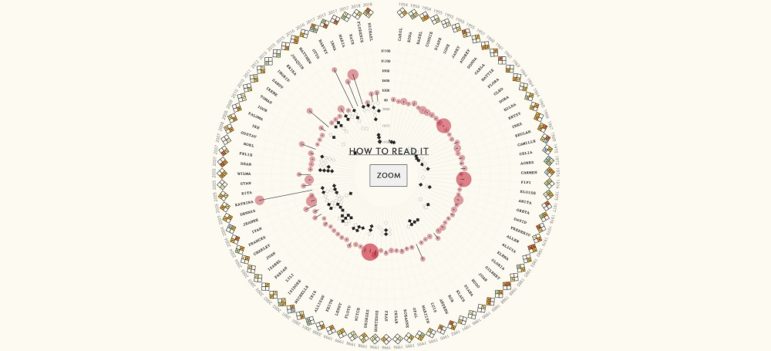
If you have tried to mix cocktails at home lately, you’re not alone. Tired of waiting for bars and restaurants to reopen, more consumers have started buying premium alcohol, according to data published by the Financial Times. Our NodeXL #ddj mapping from March 1 to 7, which tracks the most popular data journalism stories on Twitter, also found an analysis by Bloomberg showing that global food prices have hit their highest level in six years, an explainer of the connection between bats and virus outbreaks by Reuters, an interactive piece on Atlantic currents by The New York Times, and a musical map by The Pudding.

Data Journalism

Data Journalism Top 10: Biometric IDs, Data Spaghetti, Eviction Avalanche, Remote Working

With countries around the world considering the safest ways to ease lockdown measures, alongside the deployment of COVID-19 vaccines in many places, some are finding reasons to be optimistic about the end of the coronavirus crisis. But returning to once conventional daily activities, such as going to restaurants and sports stadiums, is still a distant prospect. Our NodeXL #ddj mapping from February 1 to 7 found Voxeurop covering the dangers of adopting biometric IDs and health passports, a look at Europe’s COVID-19 divide by Reuters, an analysis of leaked smartphone data by The New York Times, and a Twitter thread collection of archived data visualizations in various languages.

Data Journalism

Data Journalism Top 10: Ranking Halloween Candy, Formula 1, Canadian Prisons, COVID-19 Indoors

Gearing up for Halloween? You’ll want to refer to our NodeXL #ddj mapping from October 19 to 25. We found FiveThirtyEight’s ultimate Halloween candy ranking from the archives to please the palates of finicky trick-or-treaters. This edition also includes The Economist’s mathematical model to determine whether Formula 1 racing success depends on its driver or the car engineer; The Globe and Mail examines bias in Canada’s prison system; and El Pais looks into how to reduce the probability of COVID-19 transmissions indoors.

Data Journalism

Data Journalism Top 10: Visualizing Hurricanes, Predicting Wildfires, Social Media Algorithms, Trump Loyalty Index

How does climate change increase the likelihood of weather extremes? Our NodeXL #ddj mapping from October 12 to 18 finds ProPublica examining how the warming global climate exacerbates wildfire activity, and designer Will Chase visualizing some of the most destructive hurricanes with an interactive wheel graphic. The Financial Times is summarizing key trends of the pandemic using charts, maps, and graphics, while The Markup announced its latest project looking into the black box algorithms of social media platforms.

News & Analysis

What We’re Reading: Pakistani and Zimbabwean Journalists Detained, Race and the Newsroom, and Tips for Interviewing

In this week’s Friday 5, where we round up key reads from around the world in English, one journalist from Zimbabwe and another from Pakistan were abducted and detained, the Reuters Institute report on Race and Leadership in the News Media was released, and NPR’s Terry Gross and The New York Times’ Michael Barbaro offered up some tips on interviewing.

News & Analysis

What We’re Reading: On the Pandemic Frontlines, Gov’t Responses to COVID-19, and the Global Autocratic Crackdown

This week’s Friday 5, where we round up our favorite reads from around the world in English, we found a helpful database that’s tracking government responses to COVID-19 with the help of 400 researchers, a multimedia project on how eight journalists from around the world are coping with reporting during the pandemic, and a piece on how autocrats are cracking down on independent news sites.

Data Journalism

Data Journalism Top 10: COVID-19 Racial Inequity, Cash for the Connected, Africa’s Silent Epidemic, Amazon Safety

The coronavirus pandemic has upended the lives of people around the world, but some communities are especially hard hit. Our NodeXL #ddj mapping from July 6 to 12 finds The New York Times analyzing data that reveals Black and Latino people have been disproportionately affected by COVID-19, The Washington Post highlighting that business relief funds for the pandemic have gone to the rich and well-connected, and Bloomberg looking at more than 120 US businesses that say the coronavirus helped force them into bankruptcy.

News & Analysis

What We’re Reading: Pegasus Spyware Targets Another Journalist, Cybersecurity Reading List, and Capitalizing Black

This week’s Friday 5, where we round up our favorite reads from around the online world in English, includes a report from The Guardian and GIJN member Forbidden Stories about a Moroccan journalist targeted by Pegasus spyware, five books on cybersecurity that you should be reading, and, in the midst of the global Black Lives Matter movement, AP Stylebook’s decision to capitalize Black.

Data Journalism

Data Journalism Top 10: Unequal Pandemic Impact, COVID Contracts, Tainted Water, Data Ethics

Which communities are most economically affected by the coronavirus pandemic? Our NodeXL #ddj mapping from May 25 to 31 finds the Toronto Star looking at the effects of Canada’s lockdown on different communities in the country, ProPublica sharing a tool that lets you explore United States federal government contracts related to the coronavirus, the Financial Times analyzing excess mortality in 19 countries, and the Knight Center for the Journalism in the Americas offering a free online course on ethics in data journalism.

Resource

Tracking COVID-19 Contracts: A GIJN Guide and Webinar

How to investigate government spending related to the COVID-19 pandemic is the subject of a new resource from GIJN. Our guide describes how to understand and probe the procurement process and identifies the red flags that may signal fraud and corruption.