
Data Journalism Top 10: COVID-19 Racial Inequity, Cash for the Connected, Africa’s Silent Epidemic, Amazon Safety
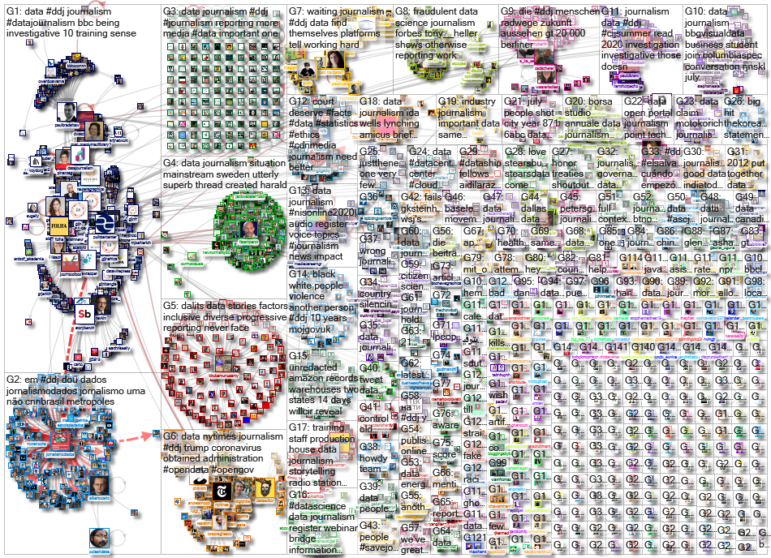
The coronavirus pandemic has upended the lives of people around the world, but some communities are especially hard hit. Our NodeXL #ddj mapping from July 6 to 12 finds The New York Times analyzing data that reveals Black and Latino people have been disproportionately affected by COVID-19, The Washington Post highlighting that business relief funds for the pandemic have gone to the rich and well-connected, and Bloomberg looking at more than 120 US businesses that say the coronavirus helped force them into bankruptcy.
Racial Inequity of the Coronavirus
The New York Times sued the US Centers for Disease Control and Prevention to obtain COVID-19 data revealing that Black and Latino people have been disproportionately affected by the coronavirus across the US, and across all age groups. Here’s a podcast on this topic.
Pandemic Cash for the Connected
After weeks of pressure from media outlets and lawmakers, the federal Small Business Administration in the US released data on the recipients of its $660 billion small-business relief program. The Washington Post examined the data and reports that COVID-19 rescue funds went to businesses owned by members of Congress, elite private schools, and a law practice that represented President Donald Trump.
https://twitter.com/hshaban/status/1280292296718761986
Silent Epidemic in Africa
A Reuters analysis found that there had been just over 420 COVID-19 tests per 100,000 people carried out across the African continent of 1.3 billion people. The lack of data due to low levels of testing suggests that the official figures do not tell the whole story of the pandemic in Africa.
Visualizing COVID-19 Bankruptcies
Many companies in the US were already in deep financial trouble before the coronavirus pandemic led governors to shut down non-essential businesses. Bloomberg visualized more than 120 firms, including retailers, airlines, restaurants, sports leagues, a cannabis company, and an archdiocese plagued by sex-abuse allegations, that have declared bankruptcy this year and blamed COVID-19 in part for their demise.
Knowledge Graphs for Investigative Reporting
Across the data science community, knowledge graphs have become a growing phenomenon in recent years, driving many applications including virtual assistants like Siri and Alexa. Friedrich Lindenberg, from the Organized Crime and Corruption Reporting Project, writes about how its data platform Aleph makes use of knowledge graphs to help investigative reporters analyze and cross-reference data.
Behind the Scenes of COVID-19 Visualizations
Local newsrooms across the US have been harnessing COVID-19 data, presenting it to audiences in an understandable format, and providing relevant context. To find out the process behind building these interactive visualizations, Poynter’s Kristen Hare spoke to the Tampa Bay Times about its infections and deaths by ZIP code tracker, the CalMatters newsroom about its coronavirus hospitalizations tracker, and The Boston Globe on its LiveGuide to virtual events.
Berlin’s Streets and Bike Paths
Der Tagesspiegel, in cooperation with FixMyBerlin, which lobbies for bike-friendly cities, conducted a large survey asking Berliners what the streets of the city, and especially bicycle paths, should look like in the future. Over 21,000 people participated and rated various automatically generated street scenes for their perceived level of safety — either from the perspective of a bicycle, from the car, or from the footpath.
Legal Threat to Data Scraping
The Markup filed an amicus brief in the US Supreme Court arguing that an overly-broad reading of the Computer Fraud and Abuse Act could endanger or limit the media’s ability to gather news, particularly in using automated data collection processes such as scraping. Read the brief here and its editor-in-chief Julia Angwin’s explanation here.
Amazon Safety Data
A judge in San Francisco ruled that the US Labor Department has to turn over unredacted safety records related to the warehouses of Amazon.com Inc. in two states. The files must be given to GIJN member Center for Investigative Reporting and its staff reporter Will Evans within 14 days of the federal court order. This decision could make it easier for media outlets and union leaders to gain similar injury and illness data in the future.
Data Journalism and Woodworking
Steven Rich, database editor for the investigations unit at The Washington Post, launched a newsletter which talks about his passion for data journalism and woodworking, and how the two intersect. Here’s the first issue.
Thanks again to Marc Smith of Connected Action for gathering the links and graphing them. The Top Ten #ddj list is curated weekly.
 Eunice Au is GIJN’s program coordinator. Previously, she was a Malaysia correspondent for Singapore’s The Straits Times, and a journalist at the New Straits Times. She has also written for The Sun, Malaysian Today, and Madam Chair.
For a look at NodeXL’s mapping on #ddj and data journalism on Twitter, check out this map.

No Coding Required: A Step-by-Step Guide to Scraping Websites With Data Miner

Free, Game-Changing Data Extraction Tools that Require No Coding Skills

Basic Data Journalism Tips for Editors

My Favorite Tools: Venezuela’s Lisseth Boon on Design and Data Visualization

How a WhatsApp Community Is Bringing India’s Data Storytellers Together

Turning the Threat to a Distant Glacier into a Local Story Through Data Visualization

Making Trillions Make Sense: How Reuters Visualized the AI Economy

Summer Reading List for Data Journalists: For Those Who Believe in the Power of Storytelling with Numbers

This work is licensed under a Creative Commons Attribution-NoDerivatives 4.0 International License
Republish our articles for free, online or in print, under a Creative Commons license.
Republish this article
This work is licensed under a Creative Commons Attribution-NoDerivatives 4.0 International License
Read Next
Data Journalism
How a WhatsApp Community Is Bringing India’s Data Storytellers Together
Recently, more than 400 people gathered in the Indian city of Bengaluru for VizChitra 2026, a conference on data visualization and storytelling — but that is only a small part of the story.
Climate Data Journalism
Turning the Threat to a Distant Glacier into a Local Story Through Data Visualization
New York Times climate and environmental graphics reporter Mira Rojanasakul discusses how her team visualized the sea level rise threat from the melting Thwaites Glacier in Antarctica.
Data Journalism
Making Trillions Make Sense: How Reuters Visualized the AI Economy
How do you make a trillion dollars feel real to someone who has never seen that much money? Vineet Khare and Mayank Bhatt faced that very challenge for their data-driven investigation into AI investment.
Data Journalism
Summer Reading List for Data Journalists: For Those Who Believe in the Power of Storytelling with Numbers
Featuring books spanning four continents, these recommended reads provide a global perspective on data journalism.