Accessibility Settings

color options

monochrome muted color dark

reading tools

isolation ruler

Tag

elections

53 posts

Data Journalism

Data Journalism Top 10: A Stunning COVID Data Blunder, Beautiful News, Arctic Fires, Eviction Abuses, Isolating Students

The advancement of technology and availability of complex data tools has been a real boon to society, but utilizing the wrong tools for the job can have dire consequences. Our NodeXL #ddj mapping from October 5 to 11 finds British media organizations the BBC and the Guardian reporting on a blunder by the English national health authority: it used the wrong Excel file format to store data, resulting in the loss of thousands of COVID-19 test data results. Meanwhile, German television news program ZDF heute highlighted how the Arctic has reached record high temperatures this year, DCist and Spotlight DC examined problems in the process of evictions, and we find Information is Beautiful offering a daily feed of uplifting news among the gloom of 2020’s news cycle.

GIJN Webinar — The US Election: Digging into Disinformation

In this GIJN webinar, “The US Election: Digging into Disinformation,” the second of two that focus on the US Election, we bring together three extraordinary journalists who will share their analysis of the election info wars —  and their tips for navigating the tsunami of disinformation while investigating in the public interest.

Data Journalism

Data Journalism Top 10: Mapping the Pandemic, Shrinking Japan, Data Recipes, Extreme Temps, Google Election Searches, FinCEN Files

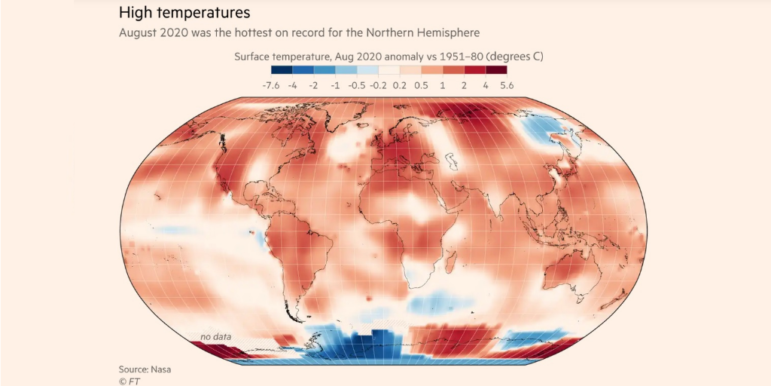
How fast is the coronavirus spreading in countries around the world? Our NodeXL #ddj mapping from September 14 to 20 finds data visualization designer Jan Willem Tulp simulating the speed of COVID-19 infections and German television news program ZDF heute mapping how the pandemic traversed the globe. Meanwhile, Thibi Recipes explores tutoring data journalism as if you’re following a cooking recipe, the Financial Times reports on climate extremes, and ICIJ and Buzzfeed bare suspect financial data.

Data Journalism

Data Journalism Top 10: North Korea Ghost Ships, Trolls Attack WHO, Al Pacino’s Wardrobe, COVID Air Travel

Satellite imagery has become increasingly useful in establishing evidence of human rights abuses and in shining a light on dubious activities being conducted in secretive parts of the world. Our NodeXL #ddj mapping from August 17 to 23 finds NBC News utilizing satellite data to solve a long-standing mystery about North Korean “ghost boats” washing up on Japanese shores, The New York Times analyzing footfall data to determine how the coronavirus pandemic has influenced consumer spending, and Bellingcat revealing a coordinated network of attacks on Twitter against the director general of the World Health Organization (WHO).

Data Journalism

Data Journalism Top 10: Election Forecasts, The Sweatpants Era, Hong Kong Protests, DJ in Eastern Europe & Caucasus

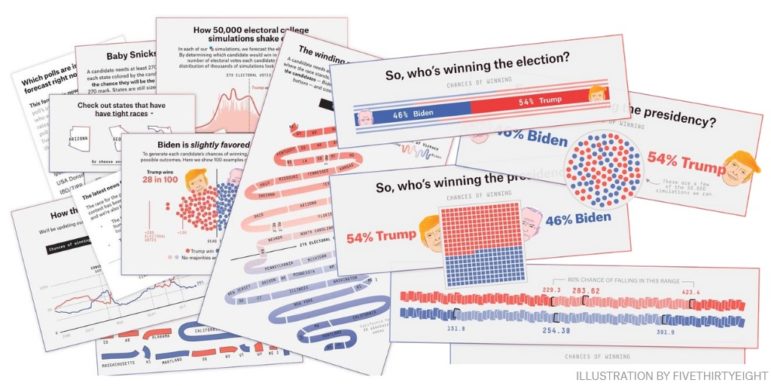
One of the biggest issues that comes with visualizing election forecasts is how to incorporate uncertainty in a way that is understandable to readers. Our NodeXL #ddj mapping from August 10 to 16 finds FiveThirtyEight explaining their election forecast design process and considerations. Elsewhere, The New York Times Magazine has been digging into the collapse of the fashion industry, and the Hong Kong Free Press is teaming up with the Journalism and Media Studies Centre of The University of Hong Kong to expand its protest research archive.

News & Analysis

After 6 Months of COVID-19, What’s Next for Pandemic Reporting?

After six months of the global crisis, investigative journalists find themselves reporting on a precarious and demoralized world, which has seen millions of jobs and more than 775,000 lives lost. In a GIJN webinar titled “Where do we go from here?”, a panel of senior journalists from Bosnia, India, Uganda, and the United States shared tips on the topics now ripe for investigation, as well as areas to improve on.

Data Journalism

Data Journalism Top 10: Black Lives Matter, Racial Wealth Gap, Pandemic Lockdown Violations, Housework Gender Inequality

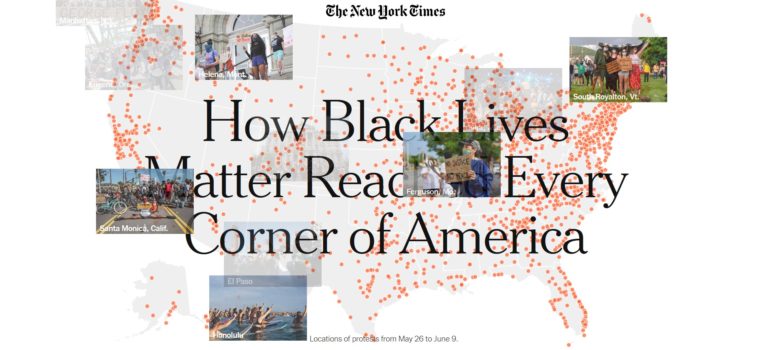
Once confined to bands of protesters, the Black Lives Matter movement has spread across America. Our NodeXL #ddj mapping from June 15 to 21 finds The New York Times mapping the protests in more than 2,000 US cities and towns over a two week period. On the coronavirus front, The Telegraph analyzed the widening racial wealth gap caused by the pandemic, the Guardian and Liberty Investigates looked into police enforcing lockdown measures disproportionately against Blacks, Asians, and other minorities, while Important Stories and Holod Media examined the fines issued by Russian courts for lockdown violations during the pandemic.

Data Journalism

Data Journalism Top 10: Royal Instagram Mystery, US Election, The Markup Launches, 100 Years of Mideast Deals

What’s the global data journalism community tweeting about this week? Our NodeXL #ddj mapping from February 24 to March 1 finds The New York Times digging into some curious data from two Instagram accounts of the British royal family, Al Jazeera analyzing Trump’s plan to resolve the Israeli-Palestinian conflict, The Markup launching with an investigation into auto insurance algorithms, and Pew Research Center sharing some American election data snapshots.