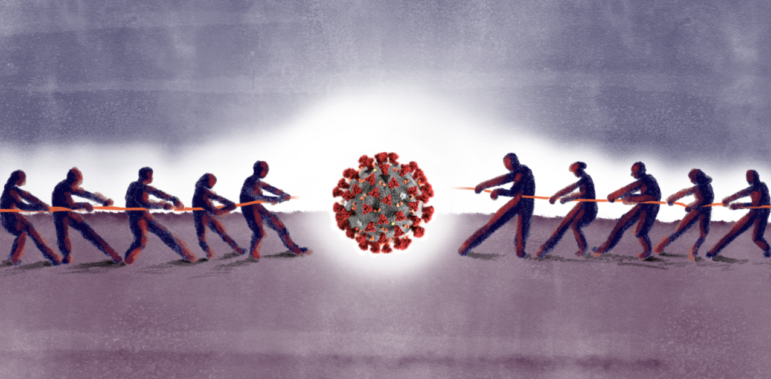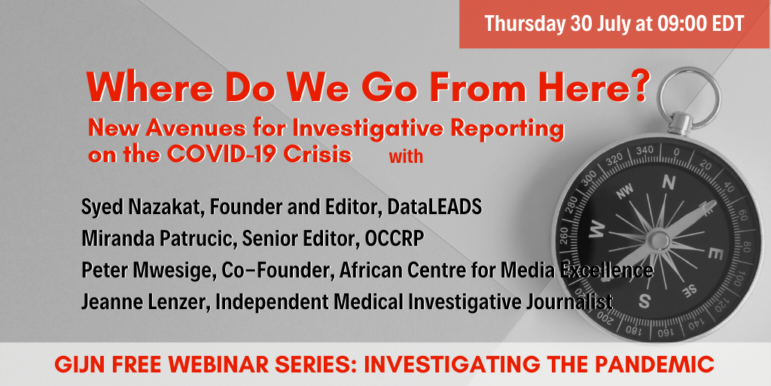
GIJN Webinar — Where Do We Go From Here? New Avenues for Investigative Reporting on the COVID-19 Crisis
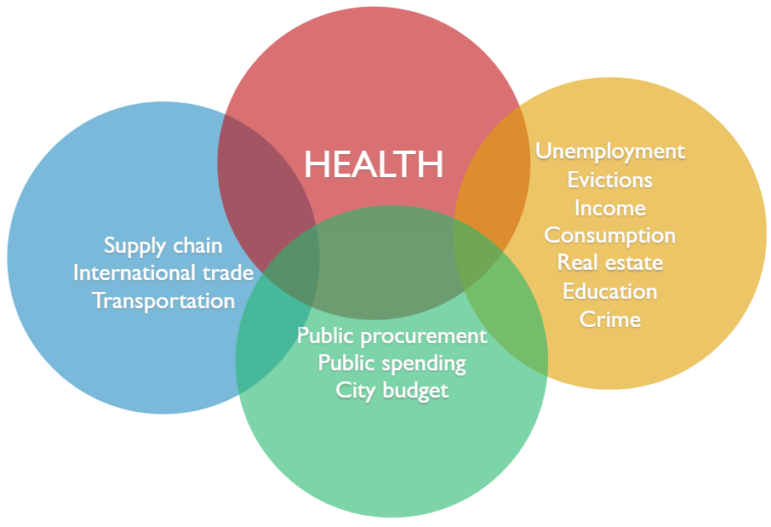
We are six months into the COVID-19 crisis, and this global pandemic is far from over. To mark this milestone, GIJN is pleased to offer its 18th webinar in our series Investigating the Pandemic. Where Do We Go From Here? – New Avenues for Investigative Reporting on the Pandemic will reflect on what investigative journalism has achieved so far and what challenges lie ahead.