Remote Sensing and Data Tools for Environmental Investigations
Read this article in


Welcome to the GIJN Toolbox, in which we survey the latest tips and tools for investigative journalists. In this edition, we’ll explore detailed databases and remote sensing tools that reporters can use to investigate local environmental threats.
Some of the resources we share below were presented as part of a webinar held by the Environmental Investigative Forum (EIF) – a nonprofit international journalism consortium. Other resources emerged in a follow-up interview with Alexandre Brutelle, a freelance investigative reporter and director of EIF.

Environmental Investigative Forum director Alexandre Brutelle. Image: Courtesy of Brutelle
In addition to a growing spirit of collaboration, Brutelle says, the outlook for environmental investigations is bright due to a combination of satellite imagery access, open source geographic information system (GIS) data tools, established databases like Global Forest Watch, and data sharing from recent investigations. As one example of the latter, he cites the growing #WildEye archive of environmental crimes released by Africa’s innovative Oxpeckers investigative outlet. Reporters can use its curated data to track court cases, asset seizures, and arrests related to illicit eco-trading, from exports of Myanmar timber to wildlife trafficking in India.
“This is a good example of a great, journalism-made environmental tool, and their data has grown far beyond their base in southern Africa – to Asia, Europe, all over,” Brutelle says.
He adds that, since its registration as a nonprofit organization in France in 2020, EIF – despite a limited budget – has grown to 60 individual members, including reporters and data science experts in the Middle East and North Africa, the Balkans, the United States, and Europe.
“The point of EIF is to connect journalists and experts,” he says. “We’re aiming to become a global consortium to foster new environmental reporting initiatives and tools.”
Global Datasets for Backgrounding Threatened Sites
When starting an investigation into a specific environmental threat – whether a new mine or a toxic spill – it’s important to have quick access to the existing conservation rules at that site, information on the environmental stakes, the area’s management history, and the stated concerns of the local community. Brutelle says the following three global databases can quickly answer many of those questions, and trigger others.
- DOPA Explorer: “One fairly simple but really useful tool is DOPA – a user-friendly catalog of internationally protected areas, including all kinds of wetlands, bird areas, Ramsar [wetland] sites, and UNESCO reserves,” notes Brutelle. “For instance, when I hear about new Western mining company operations in an African country, my first reflex is to take the coordinates and see if it overlaps with protected areas in the DOPA data.” Produced by the European Commission’s Joint Research Centre, the Digital Observatory for Protected Areas (DOPA) not only shows reporters which points on a map enjoy legal environmental protections, but also contextualizes those rules with details on vulnerable ecosystems and species in the area. “So helpful is that it also has information on other conservation issues in the areas you’re looking at, whether there are endangered species there, or animals on the red list,” he adds.
- Protected Planet: Reporters can use DOPA Explorer in conjunction with Protected Planet – a database of 269,000 terrestrial and marine protected areas that is used by both polluting industries and their watchdogs. A project of the UN Environment Programme, the site includes assessments of the management of protected areas, information on community stakeholders, and easy graphic download options for journalists, explains Christina Orieschnig, a remote sensing expert at EIF. “I really like this site – it has loads of shapefiles that you can download for any protected area in the world,” she says.
- EJAtlas: Run by the Institute of Environmental Science and Technology at the Autonomous University of Barcelona, the Environmental Justice Atlas (EJAtlas) includes a rapidly growing catalog of community impacts and environmental conflict hotspots around the world. With nodes laid out on clickable maps, the Atlas offers quick briefings on thousands of environmental struggles with at-a-glance details on, for instance, past legal outcomes and community protest incidents, and includes links to related documents, research, and activist websites.
Brutelle says the Atlas is most effective as a resource for local leads and story ideas, rather than as a primary source. For instance, while investigating abusive mining practices in North Africa, Brutelle learned from the tool that endangered bird species had also been illegally hunted by foreign royal princes in the same area. “This tool can spark ideas for new topics to investigate just by browsing,” he explains. “Otherwise, it’s more of a starting point but is useful for checking the background of any environmental exploitation or history of protest at a site you’re already looking at. It can be great when reporting on environmental abuse in remote locations, or places you can’t get to.”
SkyTruth Flaring Map
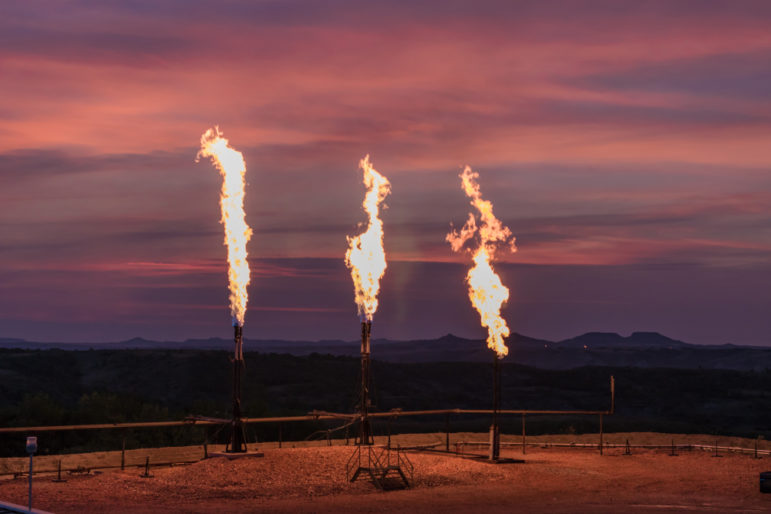
Natural gas flaring at oil wells and refineries can add large amounts of carbon dioxide and methane to the atmosphere and can be used to expel gas that is otherwise expensive to store. The flames and methane concentrations the process produces represent individual polluting activities that are detectable from space. Using automated analyses of infrared features on satellite imagery, the SkyTruth Flaring Map database produces near real-time maps of gas flaring around the globe. It also generates flaring volume maps that reflect high methane concentrations represented by red dots.
In a recent investigation into the hazards of secret, “non-conventional” gas drilling projects in southern Tunisia, EIF remote sensing analyst Momchil Yordanov tried SkyTruth for the first time – and quickly identified additional gas rigs and energy companies involved with the gas extraction.
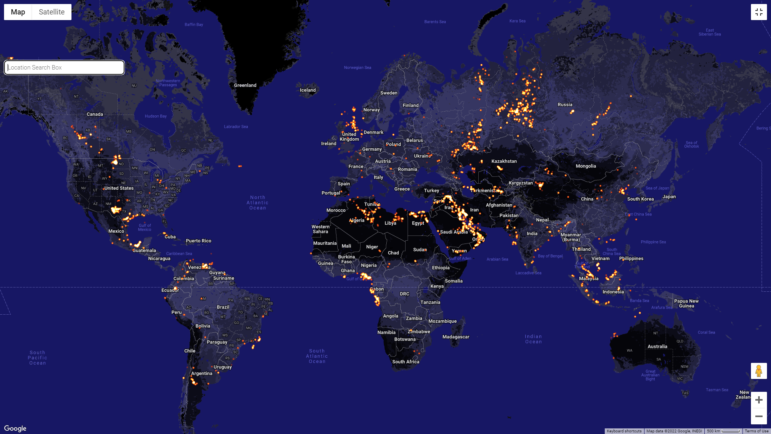
SkyTruth’s gas flaring data was recently used in an investigation of “non-conventional” drilling projects in southern Tunisia. Image: Screenshot
“It’s good on gas emission detection, definitely a tool we plan to continue working with,” says Yordanov.
Brutelle adds that SkyTruth has other “very interesting tools – on mining, for instance – but the flaring map is their global tool.”
“The resolution is good enough to measure major flaring sites,” he points out. “In your country, you can just go to the red dots on the maps and then match the flaring indication with what is going on there on the ground.”
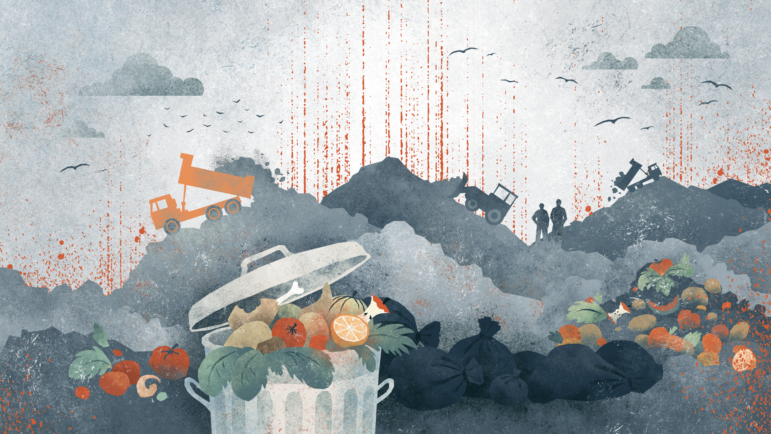
Brutelle says the tool can also be used to detect other processes that produce methane. “When you see the red dot, you can ask yourself: why is there a high methane concentration at this place, is it in a protected area, and is it above legal levels?” he says. “It could be linked to open air waste dumps, or burning trash, or burning unwanted fuel.”
For more on tracking gas flaring, check out GIJN’s Climate Change Reporting Guide on Investigating Methane.
Google Earth Engine
When asked to list her favorite investigative tool, EIF’s Orieschnig says: “Google Earth Engine, hands-down!”
Mobilizing the power of the cloud, Google Earth Engine can quickly process vast amounts of satellite image data. For instance, the Global Forest Change project, run by the University of Maryland, used the system in 2013 to process a whopping 20 terapixels of imagery from NASA’s Landsat satellite to map the global decline in forests. The researchers noted: “What would have taken a single computer 15 years to perform was completed in a matter of days using Google Earth Engine computing.”
This tool can also help investigative reporters detect and measure changes on land and water surfaces on the earth. Last year, EIF investigated the damage caused by a major wastewater spill in Bulgaria’s Lake Varna and the adjacent bay, an important fishing and tourism zone that connects to the Black Sea. The team decided to use satellite imagery to detect algal blooms on the lake but found that they needed much greater computing power to process the vast amount of data.
“I probably would have broken my computer if I did all this data analysis there, so I used Google Earth Engine,” says Orieschnig. She adds that the API — the application programming interface, which is software code that allows one website, app, or program to interact with another — is free to use so reporters “can do calculations super-fast, and quite simply, in an online Javascript programming environment. You can export results to your Google Drive, of course, but all data processing happens on Google servers.”

EIF’s Christina Orieschnig. Image: Courtesy off Orieschnig
The service also includes a ready-to-use satellite data catalog – including 40 years of imagery that is regularly updated, and searchable. Orieschnig explains that reporters should click on the “sign up” icon at the top-right of the Google Earth Engine home page to request access. “I didn’t even have to use my institutional email – it took four days to get a response, and it is free for non-commercial purposes,” she notes.
Recognizing that algae absorbs light at a different wavelength than surrounding “clean” water, Orieschnig used the data tool to measure the growth of the Lake Varna blooms in terms of their wavelength signatures. “Using the data this way, we could not only detect where algae was present, but also its concentration, which was cool,” she adds.
In general, she says phenomena larger than a school bus – from forest fires to floods and algal blooms – can be captured and measured using free, open access satellite imagery, such as Sentinel Hub, down to a resolution of 10 meters. For reporters less familiar with the Javascript API, Orieschnig recommends the tutorials at this link, and this blog for technical tips on working with geospatial data.
For more on using satellite imagery in investigations, including how journalists can submit data requests to satellite companies, check out GIJN’s guide, Resources for Finding and Using Satellite Images.
Case Study: Asia’s Mekong Delta
About 50 million people in Southeast Asia depend on the rivers and rich biodiversity of the Lower Mekong River Basin for food, energy, transport, and trade. But this vast region — stretching into Thailand, Laos, Cambodia, and Vietnam — is threatened by environmental degradation, urbanization, and the effects of climate change. Fortunately, the availability of environmental data on the Mekong Delta is growing — as it is in other regions around the world. Orieschnig – who specializes in hydrology and environmental issues in Southeast Asia – recommends that reporters in the region check out these resources:
- Mekong River Commission data portal: This database assembles and analyzes data on the condition of the waterways in the region, based on more than 10,000 datasets. “I’m really grateful for the data in this service for everything from hydrology and flooding to fisheries and land cover,” says Orieschnig.
- Mekong Dam Monitor: Produced by the Stimson Center research nonprofit, the free-to-use Mekong Dam Monitor uses satellite imagery, GIS analysis, and other data sources for up-to-date information on dams and hydropower in the region. “This also monitors operations and construction of hydroelectric projects in Southeast Asia,” she notes.
- Open Development Mekong: To find data on the human context of environmental issues in the region, Orieschnig suggests checking out this site – and country-specific sites like Open Development Cambodia – as well as its massive data hub. “They have a lot of open access data on population density, and many environmental and social issues,” she says.
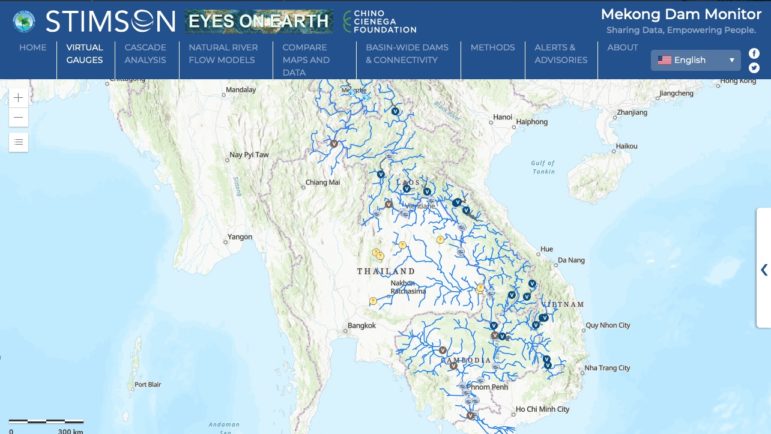
Regional databases and resources like the Mekong Dam Monitor can also be a great asset in environmental investigations. Image: Screenshot
Despite its growth in individual members and skills, EIF has limited resource capacity and is seeking funding for several initiatives. However, Brutelle says EIF hopes to ultimately develop its own toolbox of environmental monitoring tools – including artificial intelligence or AI systems to detect fracking activities – and share them as open access tools for reporters.
Says Brutelle: “We’ve already outlined three, high-impact detection and monitoring journalism tools, spawned from our member reports, that we hope to develop and share.”
Additional Resources
GIJN Toolbox: Hunting for Secret Money and Financial Conflicts of Interest
How to Expose Lies from the Skies Using Satellites and Drones
How Environmental Journalists Can Use NASA’s New Landsat 9 Satellite

Rowan Philp is a reporter for GIJN. He was formerly chief reporter for South Africa’s Sunday Times. As a foreign correspondent, he has reported on news, politics, corruption, and conflict from more than two dozen countries around the world.

This work is licensed under a Creative Commons Attribution-NoDerivatives 4.0 International License
Republish our articles for free, online or in print, under a Creative Commons license.
Republish this article
This work is licensed under a Creative Commons Attribution-NoDerivatives 4.0 International License
Read Next

Climate Data Journalism
Turning the Threat to a Distant Glacier into a Local Story Through Data Visualization
New York Times climate and environmental graphics reporter Mira Rojanasakul discusses how her team visualized the sea level rise threat from the melting Thwaites Glacier in Antarctica.
Reporting Tools & Tips
Exiled Journalists’ Tips for Source Protection and Avoiding ‘Propaganda Creep’
Veteran exiled journalists from Iran, Venezuela, and Tibet discuss source protection best practices and publishing survival strategies when reporting on your home country from afar.
Climate
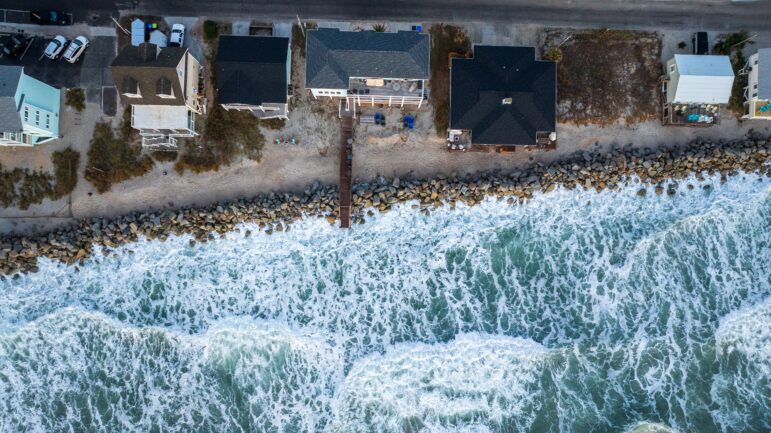
Popular Myths About Climate Adaptation Journalists Should Know
Adaptation is not a substitute for mitigation. Cutting emissions remains indispensable to preventing the worst outcomes of climate change.

Reporting Tools & Tips
Tips for Choosing Climate Stories that Make an Impact
Given widespread misinformation and climate skepticism, veteran environmental reporters offer case studies and best practices for pursuing impactful topics of climate investigations.