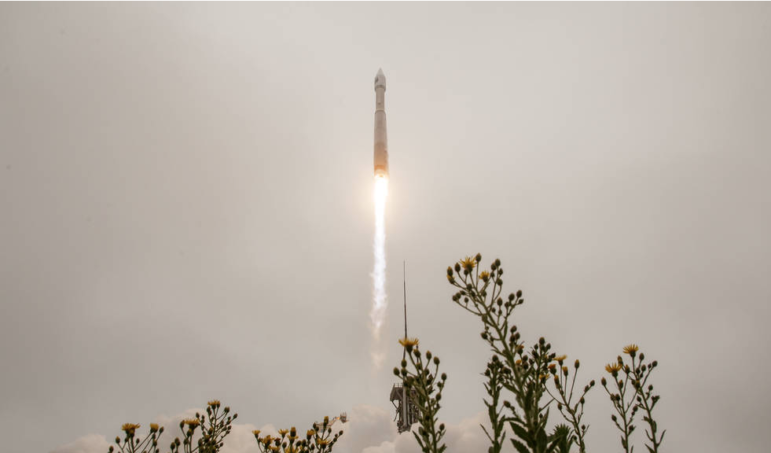
Landsat 9 launches into space on Sept. 27, 2021. Image: NASA, Bill Ingalls
How Environmental Journalists Can Use NASA’s New Landsat 9 Satellite
Read this article in
Environmental journalists may lack resources at times. But they do have at least one — whiz-bang satellites to help them explain how Earth is changing.
And in September, NASA launched another one. Landsat 9, the latest in the almost 50-year-old series, went up September 27. After about three months of shakedown and calibration, it will be regularly downloading data to anyone who asks.
And yes, ordinary journalists can get stories from it, though it might be an idea to work with tech-savvy collaborators.
Where the Data Comes From
Two earlier models, Landsat 7 and 8, are still up there and working (although 7 is slated to retire). These look at Earth’s land surface with pretty fine, 15-meter resolution, in at least nine bands of the light spectrum, returning to the same spot every 16 days or so.
The result is millions of images. Most importantly, the 50-year time series allows evidence-based conclusions about how Earth is changing (and being changed), not just globally but locally too. The Landsat 8 press kit and an image gallery give some idea of what is possible.
The Landsat series is focused on land, but there are other Earth-observing satellites. Some look at the weather, the atmosphere, or the ocean. And some commercial and ex-spy satellites have even finer resolution.
That means Landsat can show trends in deforestation (or afforestation or reforestation), forest health, agricultural crops and cover, other vegetation and cover, coastal erosion, wetland loss and restoration, soil and rock, urbanization, suburban sprawl, drought and flooding, and more.
It can also map the growth and retreat of glaciers, ice sheets and shelves, wildfire impacts, coral reefs, and lots of other natural resource features.
The secret sauce for sophisticated imaging is that it is multispectral. Different geographic features can be distinguished by their wavelengths (or signature combinations thereof). The satellites have sensors that collect light from many separate bands or wavelengths — not just visible light but infrared.
Using the Data Smartly
Access to Landsat data without charge was not always a given. Until 2008, even researchers had to pay for Landsat images.
The US Geological Survey (USGS), which runs the data part of the program once Landsat instruments are launched and working, made it free at that time. But it is considering going back to pay-for-data. So use it or lose it.
Meanwhile, USGS has made Landsat data easier to both get and to use. There’s a handy webpage that shows you most of the access menu options, organized so that scientific researchers who can handle vast amounts of data can get that, but so ordinary people who may just want to look at a specific area in specific ways can easily narrow it down.
One handy way to start exploring what is available is a viewing tool called LandsatLook 2.0. It allows you to zoom in on a specific area or time, not to mention choosing your spectrum and layering other geographic features onto the Landsat map.
Unless you are a data journalism specialist, you might do well to seek sources, experts, and collaborators to guide you through the data. Look for gurus in the geography, forestry, and natural resources departments of your local universities. Or find project leaders at relevant government agencies who do research in your area of interest.
Today, many larger news media enterprises have data journalism specialists or teams who may collaborate. Check in with the Investigative Reporters and Editors’ team at the National Institute for Computer-Assisted Reporting, or NICAR.
Story Leads and Examples
Satellite imagery (not from Landsat though) helped reporter Ana Ionova with a 2020 series on loss of the Amazon rainforest in Mongabay that won recognition from the Society of Environmental Journalists.
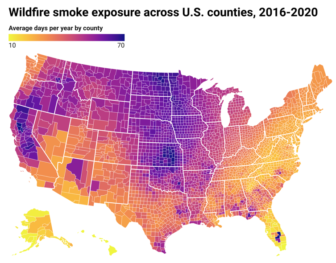
An NPR member station in California used NOAA satellite imagery to investigate the effect of wildfire smoke across the US. Image: Screenshot
More recently, NPR’s California Newsroom and Stanford University’s Environmental Change and Human Outcomes Lab used satellite data to examine the toxic effects of wildfire smoke.
And just this September, the Allen Coral Atlas announced the completion of its satellite-based atlas of coral bleaching.
You can find a lot more examples of how satellite imaging can be used in journalism projects in this paper.
You might also take a look at what SkyTruth is doing. It’s a nonprofit watchdog that uses satellite data to examine environmental issues. An example is its study of mountaintop removal mining in the Appalachia region of the United States. Find further suggestions (and more here) on developing satellite journalism stories.
This story was originally published on the website for the Society of Environmental Journalists. It is republished here with permission.
Additional Resources
New Data Tools and Tips for Investigating Climate Change
When a Picture Tells the Story: 9 Investigations That Used Satellite Imagery
Powering Up Geo-Journalism for Investigative Environmental Reporting

Joseph A. Davis is a freelance writer and editor in Washington, DC, who has been writing about the environment since 1976. He writes the Society of Environmental Journalists’ Online TipSheet, Reporter’s Toolbox, and Issue Backgrounder, and curates SEJ’s weekday news headlines service. Davis also directs SEJ’s Freedom of Information Project and writes an opinion column.

Investigating Latin America’s Global Reach Of Illicit Activities

The Investigative Agenda for Climate Change Journalism

GIJC23 – Measuring Impact

GIJC23 – What Does AI Have to Do with Investigative Journalism? Everything!
Satellite Companies Restrict Journalists’ Access to Images from the Iran War
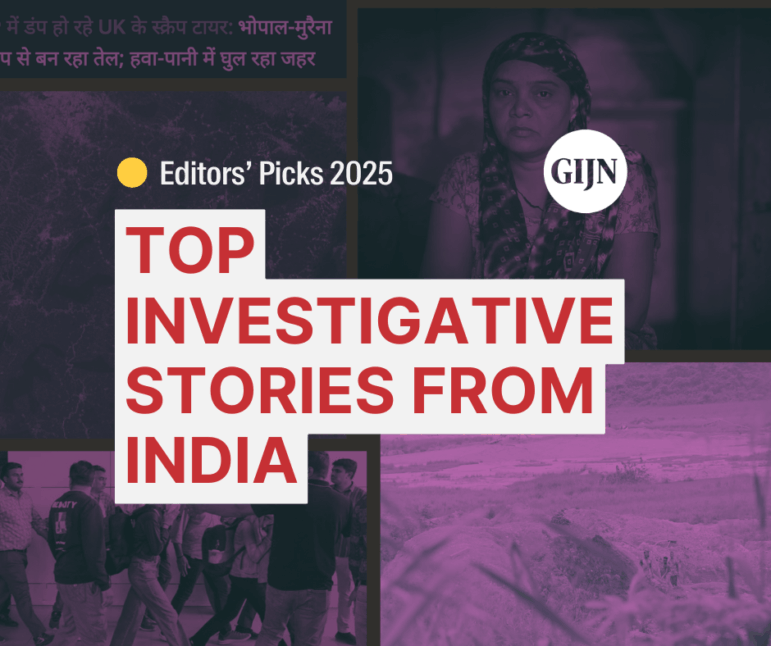
Digital Scam Trails, Deadly Hospital Infections, Harrowing Immigration Journeys: 2025’s Best Investigative Stories from India
Gold Mining Disasters, Lost Refugee Boats, AI-Powered Protest Crackdowns: Best Investigative Stories from Turkey in 2025
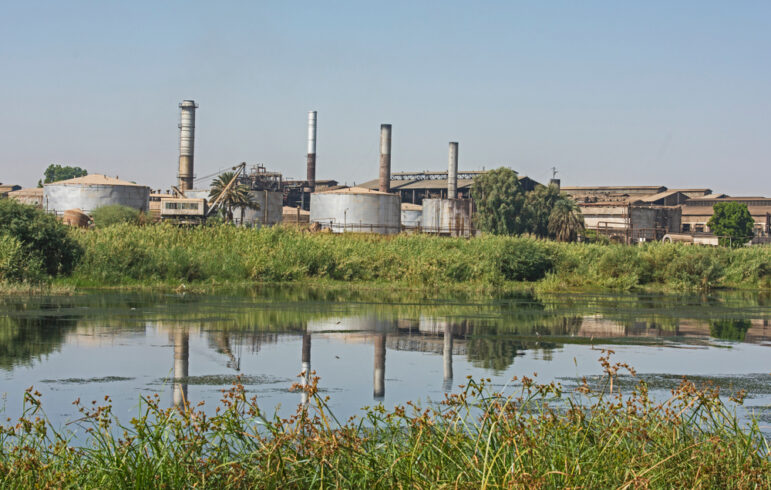
Inside the Cross-Border Network Exposing the Environmental Crisis Facing Africa’s Longest River

This work is licensed under a Creative Commons Attribution-NoDerivatives 4.0 International License
Republish our articles for free, online or in print, under a Creative Commons license.
Republish this article
This work is licensed under a Creative Commons Attribution-NoDerivatives 4.0 International License
Read Next
News & Analysis
Satellite Companies Restrict Journalists’ Access to Images from the Iran War
Going forward, two major commercial satellite imagery companies will apply a two-week hold on all images in the companies’ image archives.
Editor's Picks News & Analysis
Digital Scam Trails, Deadly Hospital Infections, Harrowing Immigration Journeys: 2025’s Best Investigative Stories from India
Also featuring deep dives into rampant worker injuries in automobile factories, health hazards from imported scrap tires, and the politicization of the national archaeological survey.
Editor's Picks News & Analysis
Gold Mining Disasters, Lost Refugee Boats, AI-Powered Protest Crackdowns: Best Investigative Stories from Turkey in 2025
Investigative journalism in the country has shown remarkable resilience, depth, and impact despite operating under difficult conditions.
News & Analysis
Inside the Cross-Border Network Exposing the Environmental Crisis Facing Africa’s Longest River
Co-founded by two journalists, InfoNile has grown into a sprawling ecosystem of cross-border investigations, multimedia storytelling, and data-driven reporting.