Data Journalism Top 10: COVID TikTok, Fact-Checking Coronavirus, Trump Narcissism, Pandemic Economy
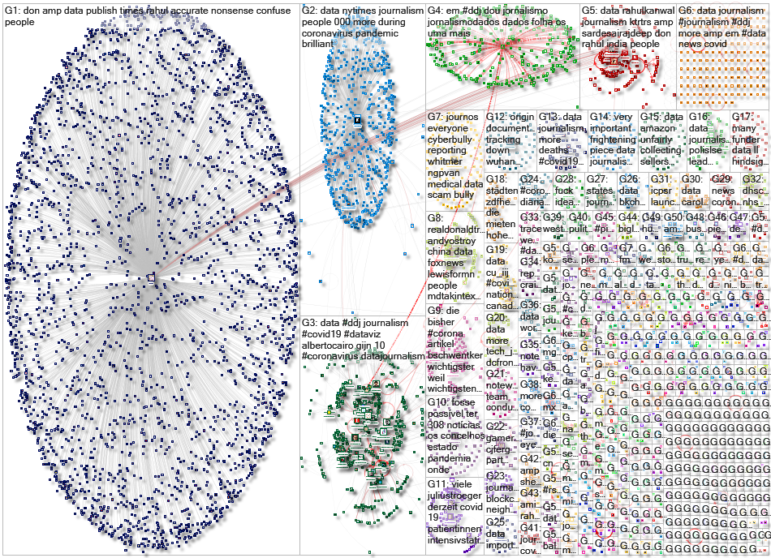
The popularity of TikTok has surged during the pandemic, and one particular “data investigation” clip has gone viral: Our NodeXL #ddj mapping from April 20 to 26 found TikTok user Rebecca fact-checking a woman’s claim about the COVID-19 quarantine and her grey hair roots. We also found the Coronavirus Fact-Checking Alliance visualizing thousands of facts they’ve checked during the pandemic; The New York Times analyzing Donald Trump’s boastful messages about the US coronavirus response; and FiveThirtyEight examining US attitudes toward the pandemic, the economy, and Trump.
COVID-19 Hair: A TikTok Investigation
TikTok has been a surprise hit during the pandemic lockdown with people sharing memes, jokes, and funny skits on the platform. One user named Rebecca, who goes by @rebabeba, took it a step further to fact-check a woman’s claim that quarantine measures are the cause of her being unable to dye her gray hair roots. According to Rebecca’s calculations, she believes the woman hasn’t dyed her hair since October 2019 — not, as she claimed, just since the lockdown measures started.
https://twitter.com/TaylorLorenz/status/1253017353757081601
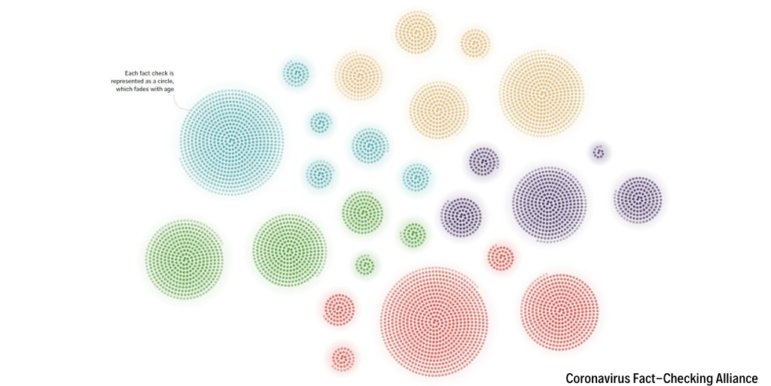
Visualizing Fact Checks
Led by the International Fact-Checking Network at the Poynter Institute, the #CoronaVirusFacts Alliance unites more than 100 fact-checking organizations around the world. To date, the alliance has published more than 3,500 fact checks in over 70 countries and more than 40 languages. Filter the fact checks by topic, clusters, and timeline in these maps.
https://twitter.com/AlbertoCairo/status/1253690484549173249
Trump Self-Congratulates on COVID Response
Three journalists from The New York Times reviewed more than 260,000 words spoken by US President Donald Trump during the pandemic. The transcripts show striking patterns and repetitions in the messages he has conveyed, revealing a vast display of congratulatory and complimentary messages for himself which are often based on exaggerations and falsehoods.
https://twitter.com/jwpetersNYT/status/1254742308555304961
How Concerned Are Americans About COVID-19?
FiveThirtyEight are collecting polls measuring how concerned Americans are about COVID-19 to give us an understanding of how the population is reacting to the health crisis. It also took a look at the share of those who approve of President Donald Trump’s handling of the coronavirus outbreak, which varies widely by party.
The True Toll of the Pandemic
According to The New York Times, at least 40,000 more people have died during the coronavirus pandemic than the official COVID-19 death counts report. By comparing the number of people who died from all causes this year with the historical average of deaths during the same period in twelve countries, the Times was able to estimate the excess mortality for each country.
Excess COVID-19 Mortality
The Financial Times is also looking into excess mortality by reviewing data from the Office for National Statistics in the United Kingdom, which showed that deaths at home and in care homes have jumped sharply during the pandemic. Carl Heneghan, professor of evidence-based medicine at Oxford University, said that the coronavirus was not given as the cause on many of the death certificates but was likely to be a direct or indirect factor. The FT’s economics editor Chris Giles explains the estimation in this tweet thread, and journalist John Burn-Murdoch offers some insights here.
How to Handle COVID-19 Data
The International Center for Journalists is connecting journalists with health experts and newsroom leaders through a webinar series on COVID-19. In this webinar, visual journalist Davide Mancino said exact figures on those infected by COVID-19 don’t exist, but he offered ways to report on what scientists do know, and to use data visualizations to convey this information clearly and accurately to the public.
Impact of COVID-19 in Mexico
The first case of COVID-19 in Mexico was confirmed on February 27. Since then, the numbers of infected increased to 15,529 cases as of April 27. El Universal looks into the magnitude of the disease in the country. You can filter cases by state, age, gender, and other medical conditions.
Canada’s COVID-19 Data Initiative
Concordia’s Institute for Investigative Journalism launched a Canada-wide COVID-19 data project to provide free up-to-the-minute maps, audience engagement tools, and other resources for all Canadian media.
History of Data Graphics
The MIT Press just released the book “The Infographic: A History of Data Graphics in News and Communications” last month. The book, written by Murray Dick, a multimedia journalism lecturer at Newcastle University, explores infographics and data visualization as a cultural phenomenon, from 18th-century print culture to today’s data journalism.
Thanks again to Marc Smith of Connected Action for gathering the links and graphing them. The Top Ten #ddj list is curated weekly.
 Eunice Au is GIJN’s program coordinator. Previously, she was a Malaysia correspondent for Singapore’s The Straits Times, and a journalist at the New Straits Times. She has also written for The Sun, Malaysian Today, and Madam Chair.
For a look at NodeXL’s mapping on #ddj and data journalism on Twitter, check out this map.

Basic Data Journalism Tips for Editors

My Favorite Tools: Venezuela’s Lisseth Boon on Design and Data Visualization

Document of the Day: Visual Vocabulary

Reporter’s Guide to Investigating Cryptocurrency

How a WhatsApp Community Is Bringing India’s Data Storytellers Together

Turning the Threat to a Distant Glacier into a Local Story Through Data Visualization

Making Trillions Make Sense: How Reuters Visualized the AI Economy

Summer Reading List for Data Journalists: For Those Who Believe in the Power of Storytelling with Numbers

This work is licensed under a Creative Commons Attribution-NoDerivatives 4.0 International License
Republish our articles for free, online or in print, under a Creative Commons license.
Republish this article
This work is licensed under a Creative Commons Attribution-NoDerivatives 4.0 International License
Read Next
Data Journalism
How a WhatsApp Community Is Bringing India’s Data Storytellers Together
Recently, more than 400 people gathered in the Indian city of Bengaluru for VizChitra 2026, a conference on data visualization and storytelling — but that is only a small part of the story.
Climate Data Journalism
Turning the Threat to a Distant Glacier into a Local Story Through Data Visualization
New York Times climate and environmental graphics reporter Mira Rojanasakul discusses how her team visualized the sea level rise threat from the melting Thwaites Glacier in Antarctica.
Data Journalism
Making Trillions Make Sense: How Reuters Visualized the AI Economy
How do you make a trillion dollars feel real to someone who has never seen that much money? Vineet Khare and Mayank Bhatt faced that very challenge for their data-driven investigation into AI investment.
Data Journalism
Summer Reading List for Data Journalists: For Those Who Believe in the Power of Storytelling with Numbers
Featuring books spanning four continents, these recommended reads provide a global perspective on data journalism.