Accessibility Settings

color options

monochrome muted color dark

reading tools

isolation ruler

Tag

graphics

17 posts

Data Journalism

Data Journalism Top 10: Misrepresenting Women, Bubble Tea, and India’s Nightingale

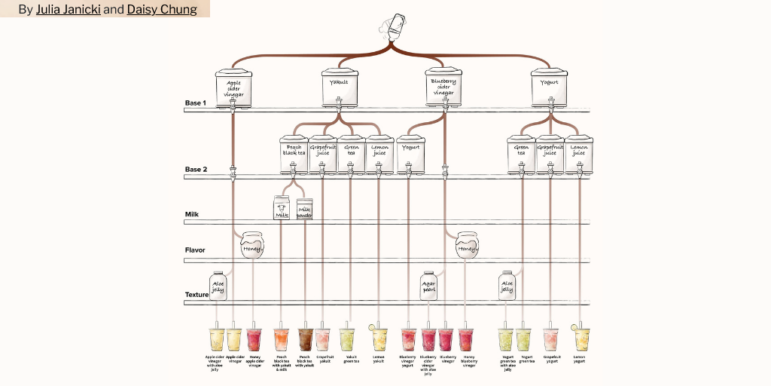
Our weekly NodeXL curation of the most popular data journalism stories on Twitter includes a look at how women in the headlines can be used to perpetuate existing stereotypes, an examination of how large pockets of unvaccinated individuals are driving the pandemic in the US, and a fun make-your-own bubble tea interactive adventure.

Data Journalism

Data Journalism Top 10: Beauty Biz Bias, Suez Blockage, Facebook Fail, Migrants at the Border, Europe’s Theaters

For nearly a week, a giant container ship stranded in the Suez Canal blocked one of the busiest trade routes in the world. The Ever Given, a Rotterdam-bound vessel, was finally freed from the shoreline on Monday, and international media have closely followed the story and the consequences of the blockage. Our NodeXL #ddj mapping from March 22 to 28, which tracks the most popular data journalism stories on Twitter, found a visual story by the Reuters Graphics team that illustrated how the incident affected global trade. In this edition, we also feature an examination of bias in the beauty industry by The Pudding, a look into how the pandemic changed society by Al Jazeera, and a guide to drawing data visualizations by DataJournalism.com.

Data Journalism

My Favorite Tools: Alberto Cairo on Data Visualization

For our series on journalists’ favorite tools, we spoke to Alberto Cairo, head of visualization at the University of Miami’s Institute for Data Science and Computing. Cairo shared several user-friendly tools and core principles to help investigative reporters shape their data visually to create new insights for audiences.

Data Journalism

Data Journalism Top 10: How US Infection Spread, Data Hires, Identity Theft, and Lightning Strikes vs. Lottery Wins

Our NodeXL #ddj mapping from June 22 to 28 finds The New York Times analyzing travel patterns and genetic data to show how the disease spread across the United States, and the impact it has had on nursing homes and elderly care facilities. The Washington Post is responding to the increasing importance of visual data communication by expanding its data and graphics team, and the Pulitzer Center is calling for data journalism story proposals.

News & Analysis

How The New York Times Visualized Global Trends in White Extremist Attacks

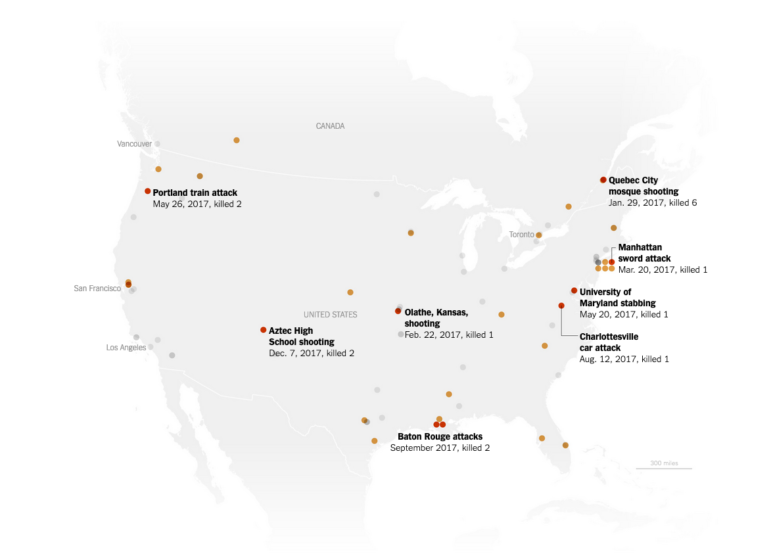
Last year The New York Times published an interactive article on white extremist killings from New Zealand to Norway to the United States. Using maps and a timeline to plot the data, the project revealed the troubling frequency and, in some cases, strange connections between the events. Here graphic designer Weiyi Cai explains how they obtained the data for project and the decisions they made about visualizing it.

Data Journalism

10 Tips for Visualizing COVID-19 Data

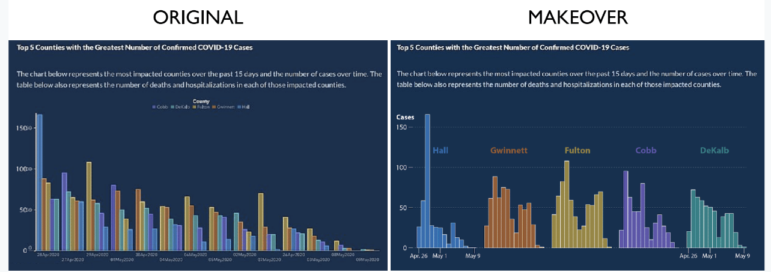
In the latest webinar in the GIJN series on Investigating the Pandemic, an investigative reporter, a health data expert, and a world-renowned visualization professor shared insights on what newsrooms should consider when presenting COVID-19 information visually. An online audience of journalists from 46 countries heard that clear explanation and transparency were critical for all graphic formats.

Data Journalism

Data Journalism Top 10: COVID TikTok, Fact-Checking Coronavirus, Trump Narcissism, Pandemic Economy

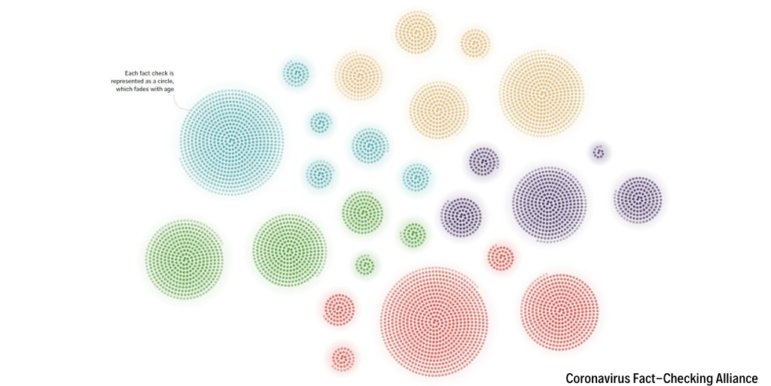
The popularity of TikTok has surged during the pandemic, and one particular “data investigation” clip has gone viral. Our NodeXL #ddj mapping from April 20 to 26 found TikTok user Rebecca fact-checking a woman’s claim about the COVID-19 quarantine and her grey hair roots, the Coronavirus Fact-Checking Alliance visualizing the thousands of fact checks they have produced during the pandemic, The New York Times analyzing United States President Donald Trump’s messages about the country’s coronavirus response, and FiveThirtyEight examining how concerned Americans are about the coronavirus compared to the economy.

Data Journalism

GIJN’s Data Journalism Top 10: Weird Maps, ‘Out of Control’ Airbnb, Augmented Reality Graphics, Russian Doctors, Brazilian Data

What’s the global data journalism community tweeting about this week? Our NodeXL #ddj mapping from February 17 to 23 finds geographer Tim Wallace collecting some amusingly unusual maps, The Guardian analyzing the effect of Airbnb’s prevalence on home ownership in Great Britain, the Data Visualization Society evaluating the successes and shortcomings of its first year, and former Ogilvy & Mather chief creative officer Tham Khai Meng sharing how a Japanese newspaper utilized augmented reality to animate graphics.

Data Journalism

GIJN’s Data Journalism Top 10: Luanda Leaks, A Disappeared Lake, Animated Graphics, Data Mapping, NICAR

What’s the global data journalism community tweeting about this week? Our NodeXL #ddj mapping from January 13 to 19 finds the International Consortium of Investigative Journalists exposing how Africa’s richest woman really made her fortune, The Washington Post using satellite imagery to show the disappearance of an entire lake in the Philippines, El País sharing the behind-the-scenes process of their work, and Mike Reilley curating a mega list of useful data journalism tools.