Data Journalism
Data Journalism’s Top Ten
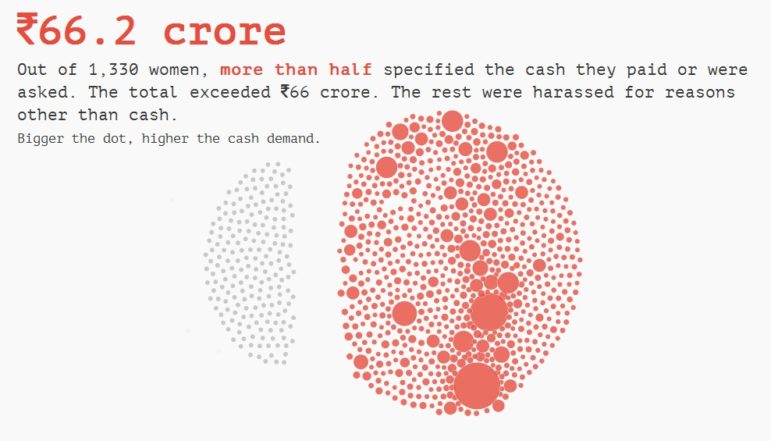
What’s the global data journalism community tweeting about this week? Our NodeXL #ddj mapping from August 21 to 27 has useful digital forensics tools from @bellingcat, mathematician Cathy O’Neil warning us about blind faith in big data and an analysis of Delhi’s insane dowry demands by @htTweets.