Data Journalism
This Week’s Top 10 in Data Journalism
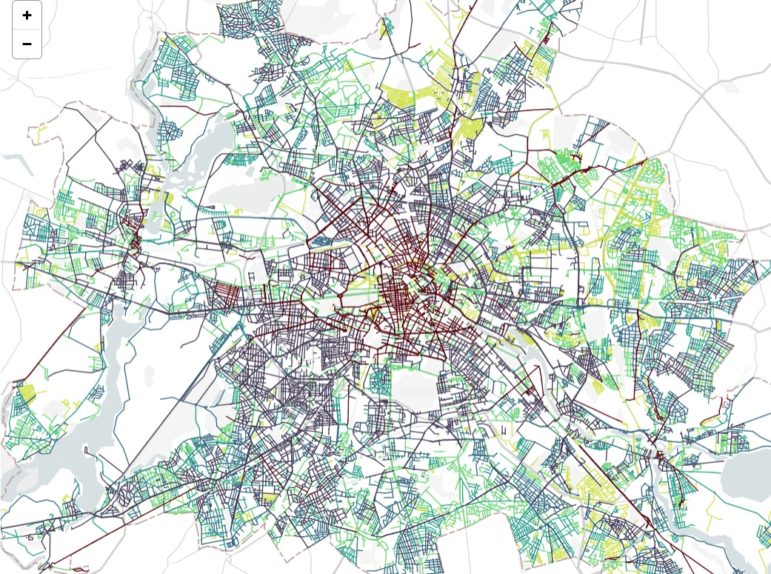
What’s the global data journalism community tweeting about this week? Our NodeXL #ddj mapping from January 22 to 28 finds a gorgeous data visualisation of German streets by @zeitonline, a detailed data analysis of Roger Federer’s tennis career by @srfdata and a look at eight alternatives in redistricting US voting boundaries by @FiveThirtyEight.