Accessibility Settings

color options

monochrome muted color dark

reading tools

isolation ruler

Tag

charts

50 posts

Data Journalism

GIJN’s Data Journalism Top 10 in 2018: Visual Vocabulary, Eclectic Visualization, Google Dataset Search, Laughing in Parliament

It’s been a great year for data journalism and visualizations. GIJN’s Top 10 #ddj series captured snapshots of what’s popular on Twitter among the global data journalism community for 46 weeks in 2018. For this edition, we asked NodeXL to map 2018’s most popular #ddj tweets from January 1 to December 11 and the results are in. This year’s most popular tweets include @FinancialTimes’ ever-popular Visual Vocabulary chart, @Google’s Dataset Search, @hnrklndbrg’s eclectic visualizations, and @SZ’s analysis of Germany’s parliamentarians using laughter as a debate weapon.


Data Journalism

GIJN’s Data Journalism Top 10: Dear Abby Data, South Africa’s Pit Toilets, The Economist’s Inequality, Politico Goes Open Source

What’s the global data journalism community tweeting about this week? Our NodeXL #ddj mapping from November 19 to 25 finds society’s most urgent concerns in the textual data of a long-standing @dearabby column, a kerfuffle over @The Economist’s regional inequality graph, dangerous pit toilets in Africa highlighted by @SECTION27news and a gift of sorts from @politico, who open sourced their elections data management system.

Data Journalism

GIJN’s Data Journalism Top 10: Stories with Maps, Tools with Charts, Casting for Shakespeare

What’s the global data journalism community tweeting about this week? Our NodeXL #ddj mapping from October 15 to 21 finds @Esri’s @AllenCarroll talking the power of maps in storytelling, @visualizingdata’s catalogue of charts and corresponding tools to help information designers, and @ericwilliamlin’s deep dive into the data of casting decisions in Shakespearean plays since the 1900s.

Reporting Tools & Tips

5 Tools for Professional Looking Infographics for the Non-Designer

For newsrooms that want to produce professional looking infographics but don’t have the technical skills or budget to hire a professional, Kat Duncan came up with five user-friendly tools to help you create neat looking infographics without worrying about too much coding.

Data Journalism Reporting Tools & Tips

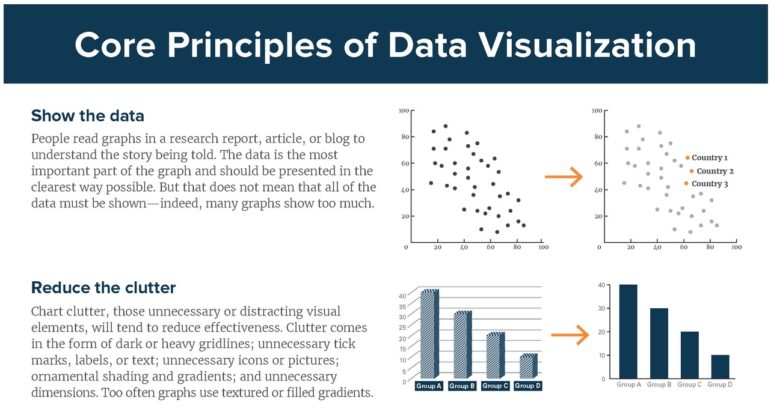
Document of the Day: DataViz Cheatsheet

Economist Jonathan Schwabish created a handy data visualization cheatsheet with straightforward key principles to adhere to when creating data visualizations. Remember: avoid 3D, make labels easy to read and try small multiples.

Data Journalism

GIJN’s Data Journalism Top 10: Muslims to Mecca, Women (Not) in Netflix, Inside Airbnb Europe, London’s Foul Air

What’s the global data journalism community tweeting about this week? Our NodeXL #ddj mapping from Aug 20 to 26 finds @Numerama analyzing the representation of women in @netflix series and finds it lacking, @AJEnglish creating an interactive explainer on how 2 million Muslims make the pilgrimage to Mecca every year, @FT readers brainstorming air pollution solutions for London, and @Bastamag digging into data of @Airbnb — a cash cow for home renters.

Data Journalism

GIJN’s Data Journalism Top 10: Egyptian Bots, Pocket Inequality, Loner Jobs and Knife Emergencies

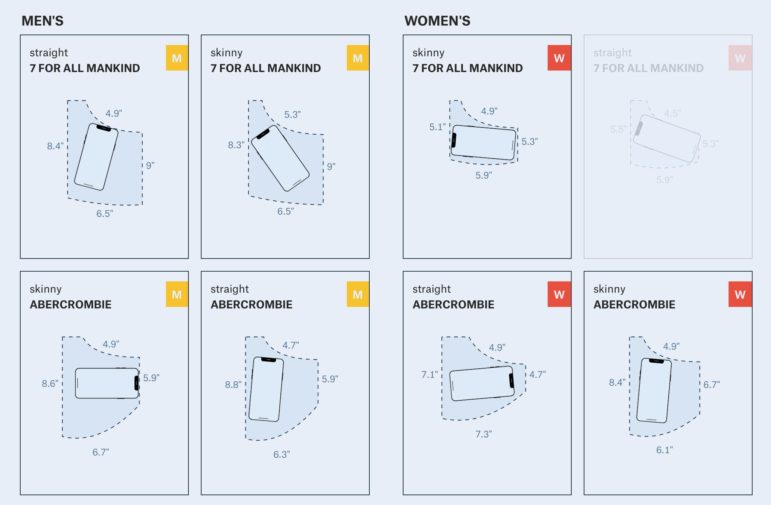
What’s the global data journalism community tweeting about this week? Our NodeXL #ddj mapping from Aug 13 to 19 finds @puddingviz proving that women’s pockets are inferior to men’s once and for all, @vizzuality pondering the impact cartographers have on our understanding of the world by presenting nocturnal activity in daytime maps, @InfoTimes_ discovering the bots behind the political debate in Egypt and @hnrklndbrg’s visualizations on everything from loner jobs to knife emergency room visits.

Data Journalism

GIJN’s Data Journalism Top 10: Dam Disaster in Laos, Global Star Gazing, Why We Love Pie Charts

What’s the global data journalism community tweeting about this week? Our NodeXL #ddj mapping from July 23 to 29 finds @NadiehBremer visualizing beautiful constellations imagined by different cultures, @mslima diving deep into why we love pie charts, @leigh_tami18 explaining the various methods of joining datasets and the Reuters Graphic’s team visualization of the dam disaster in Laos.

Data Journalism

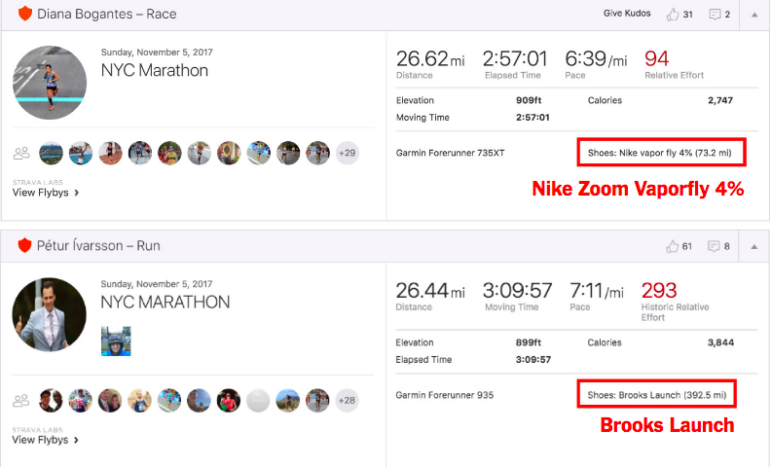
GIJN’s Data Journalism Top 10: Nike’s Vaporflys, Trump’s Trade War, FastCharts, Datapasta

What’s the global data journalism community tweeting about this week? Our NodeXL #ddj mapping from July 16 to 22 finds @UpshotNYT confirming Nike’s claim that their Vaporflys really do give runners an advantage, @FinancialTimes visualizes Trump’s escalating trade war, Britain’s digital divide and introduces their new charting tool and @MilesMcBain makes some data journalists very happy by creating Datapasta.

Data Journalism

This Week’s Top 10 in Data Journalism

What’s the global data journalism community tweeting about this week? Our NodeXL #ddj mapping from March 19 to 25 finds a sobering study on income inequality between black and white males visualized by @nytimes, a cool time-lapse graphic of snow fall in the United States by @PostGraphics and peak baby-making seasons by country by @VismeApp and @ddjournalism.