GIJN’s Data Journalism Top 10: Egyptian Bots, Pocket Inequality, Loner Jobs and Knife Emergencies
What’s the global data journalism community tweeting about this week? Our NodeXL #ddj mapping from Aug 13 to 19 finds @puddingviz proving that women’s pockets are inferior to men’s once and for all, @vizzuality on cartographers presenting nocturnal activity in daytime maps, @InfoTimes_ discovering the bots behind political debate in Egypt, @Bahareh360 on where to study ddj, and @hnrklndbrg’s visualizations on everything from loner jobs to knife emergency-room visits.
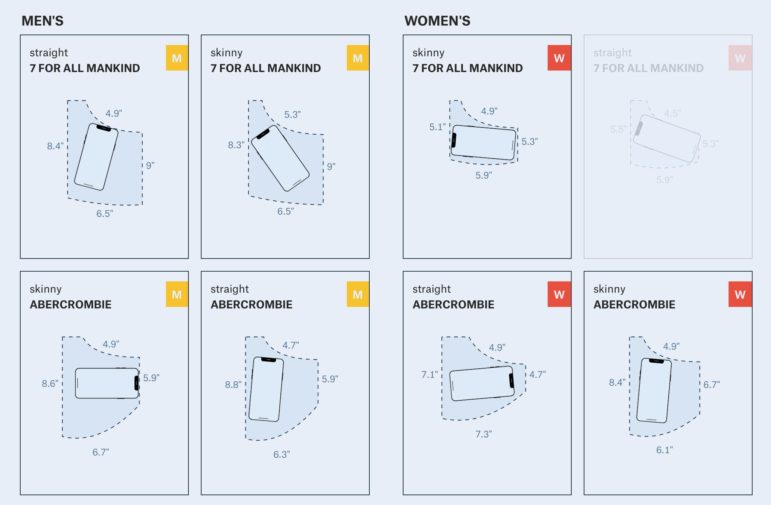
Pudding’s Pocket Inequality
Women worldwide already know the pockets on women’s jeans are impractically tiny, and now Pudding has provided the data and analysis to prove it. Dive into the data of pocket inequality.
Are Maps Afraid of the Dark?
In this piece from April, social scientist Jamie Gibson discusses how developers of maps tend to use daytime basemaps to present their data even if they are looking at nocturnal activity, and how these choices have an impact on our understanding of the world.
Bots Dominate Political Debate in Egypt
InfoTimes analyzed political hashtags on Twitter from opposing sides in Egypt and found that some of the intensive tweeting and retweeting of the hashtag were done by automated accounts.
Loner Jobs and Knife Emergency Room Visits
Swedish “maker of charts” Henrik Lindberg collates all his data visualizations under one roof. His beautiful data visualizations are an eclectic bunch, from Knife Emergency Room Visits to Loner Jobs.
Hot and Dry Records
Spiegel Online created interactive charts in which readers can check how hot and dry their city was between April and July 2018 compared to previous years.
Dataset for Data Journalism Studies
Information scientist and data journalist Dr. Bahareh Heravi compiled a dataset of 219 unique data journalism-related modules and programs offered around the world.
US Midterms Forecast
FiveThirtyEight prepared a 2018 US midterms election forecast. You can view the chances of each candidate winning for every district. The forecast will be updated every day through to November 6.
Data Literacy Association Launched in Turkey
The Data Literacy Association was established last month in Turkey with eight pioneers aiming to add skills in data literacy and data analysis. Membership is open to anyone who either wants to produce data projects or contribute to the development of the use of data. Here’s the article in Turkish.
Open Data Brazil
Brasil.io was created to make Brazilian data in the public interest available in accessible formats. Browse their repository of public data and join their chat to learn how to collaborate.
Trucking in Venezuela
The Hilux truck leads production and automative sales in the worse automative period in Venezuela.
Thanks, once again, to Marc Smith of Connected Action for gathering the links and graphing them.
 Eunice Au is GIJN’s program coordinator. Previously, she was a Malaysia correspondent for Singapore’s The Straits Times, and a journalist at the New Straits Times. She has also written for The Sun, Malaysian Today and Madam Chair.
For a look at Marc Smith’s mapping on #ddj on Twitter, check out this map.


Guide to Mapping Analysis Using QGIS

Basic Data Journalism Tips for Editors

My Favorite Tools: Venezuela’s Lisseth Boon on Design and Data Visualization

Document of the Day: Visual Vocabulary

How a WhatsApp Community Is Bringing India’s Data Storytellers Together

Turning the Threat to a Distant Glacier into a Local Story Through Data Visualization

Making Trillions Make Sense: How Reuters Visualized the AI Economy

Summer Reading List for Data Journalists: For Those Who Believe in the Power of Storytelling with Numbers

This work is licensed under a Creative Commons Attribution-NoDerivatives 4.0 International License
Republish our articles for free, online or in print, under a Creative Commons license.
Republish this article
This work is licensed under a Creative Commons Attribution-NoDerivatives 4.0 International License
Read Next
Data Journalism
How a WhatsApp Community Is Bringing India’s Data Storytellers Together
Recently, more than 400 people gathered in the Indian city of Bengaluru for VizChitra 2026, a conference on data visualization and storytelling — but that is only a small part of the story.
Climate Data Journalism
Turning the Threat to a Distant Glacier into a Local Story Through Data Visualization
New York Times climate and environmental graphics reporter Mira Rojanasakul discusses how her team visualized the sea level rise threat from the melting Thwaites Glacier in Antarctica.
Data Journalism
Making Trillions Make Sense: How Reuters Visualized the AI Economy
How do you make a trillion dollars feel real to someone who has never seen that much money? Vineet Khare and Mayank Bhatt faced that very challenge for their data-driven investigation into AI investment.
Data Journalism
Summer Reading List for Data Journalists: For Those Who Believe in the Power of Storytelling with Numbers
Featuring books spanning four continents, these recommended reads provide a global perspective on data journalism.