Accessibility Settings

color options

monochrome muted color dark

reading tools

isolation ruler

Tag

charts

50 posts

Data Journalism

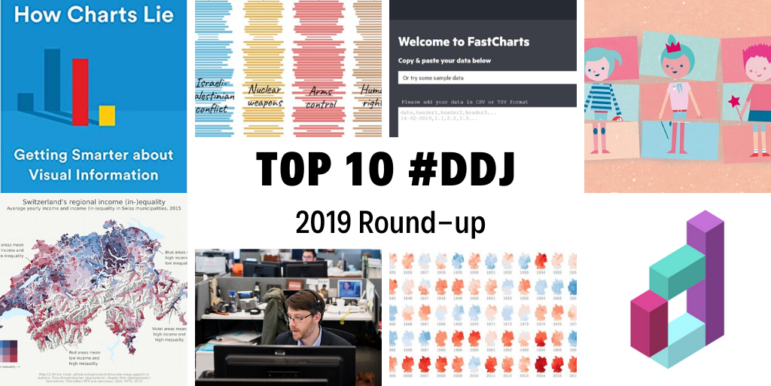
GIJN’s Data Journalism Top 10 for 2019: People Are The Story, Pirates vs. Princesses, Open Source Journalism, How Charts Lie, UN Votes

Throughout this year, we’ve brought you weekly “snapshots” of the Twitter conversation surrounding data journalism. But this week, we look at what the global data journalism community tweeted about the most during all of 2019. Below you’ll find links to stories from Brazil, Germany, Switzerland, the UK, the US, and elsewhere.

Data Journalism

GIJN’s Data Journalism Top 10: Open Source, Artificial Intelligence, Interactive Oceans, Bar Chart Races, EU Polling

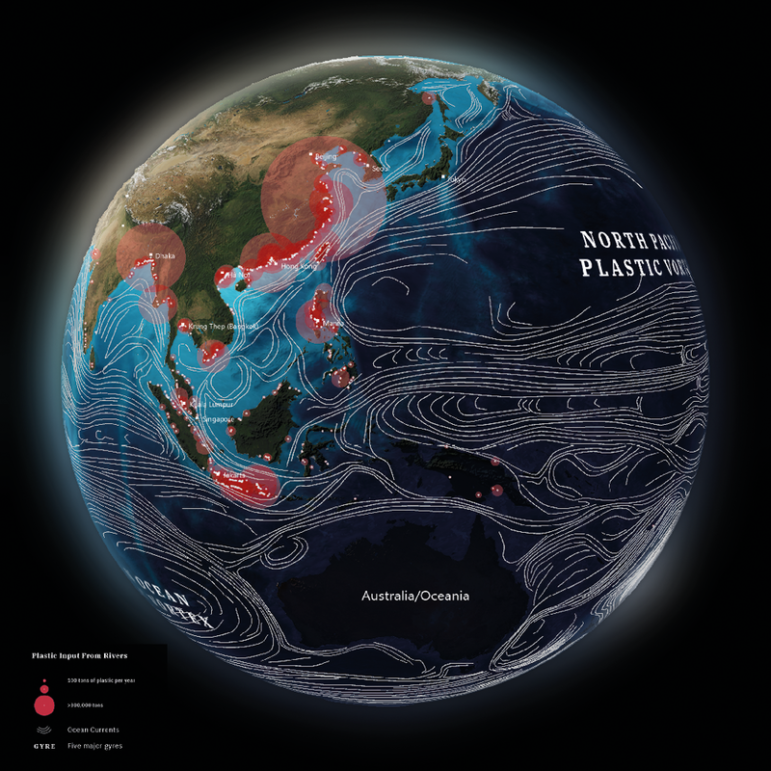
What’s the global data journalism community tweeting about this week? Our NodeXL #ddj mapping from November 25 to December 1 finds The New York Times profiling Bellingcat and its use of OSINT techniques; the International Consortium of Investigative Journalists and Stanford University collaborating to employ artificial intelligence to solve a journalistic problem; and the Science Communication Lab creating a beautiful interactive scientific poster to explore the world’s oceans.

Data Journalism

GIJN’s Data Journalism Top 10: Thanksgiving Travel, Visualization Art, Bad Charts, Dataharvest

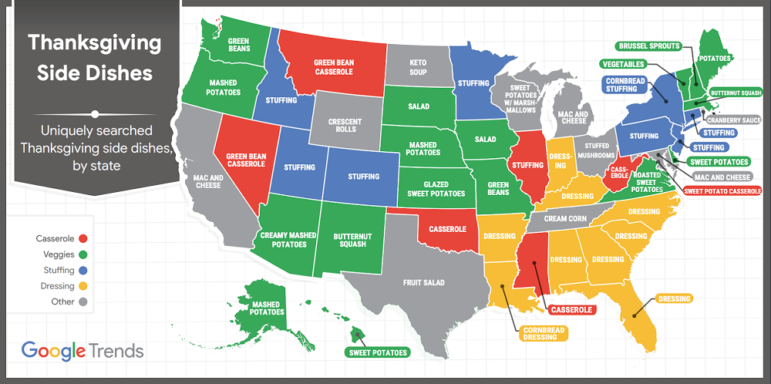
What’s the global data journalism community tweeting about this week? Our NodeXL #ddj mapping from November 18 to 24 finds Google Trends mapping the busiest places and times for Thanksgiving, Al Jazeera profiling the work of data journalist Mona Chalabi and her hand-drawn visualizations, the Tow Center for Digital Journalism examining the use of machine learning and artificial intelligence in journalism, and the Investigative Reporting Workshop collating useful public datasets in one place.

Data Journalism

GIJN’s Data Journalism Top 10: Dealing Brexit, Following the Money, Swiss Greens, and a Kyrgyz Park Scam

What’s the global data journalism community tweeting about this week? Our NodeXL #ddj mapping from October 21 to 27 finds a panel of leading data visualization practitioners discussing the practice of visualization in an age of disinformation, Kloop exposing how Kyrgyzstani authorities privatized large swaths of a public park with no oversight, and The Guardian highlighting the minimal changes between former British prime minister Theresa May’s Brexit deal with current PM Boris Johnson’s new deal.

Data Journalism

GIJN’s Data Journalism Top 10: Giraffe Anatomy, 3D Animation, Pub Crawls, ISIS Talks, Trump Lobbyists

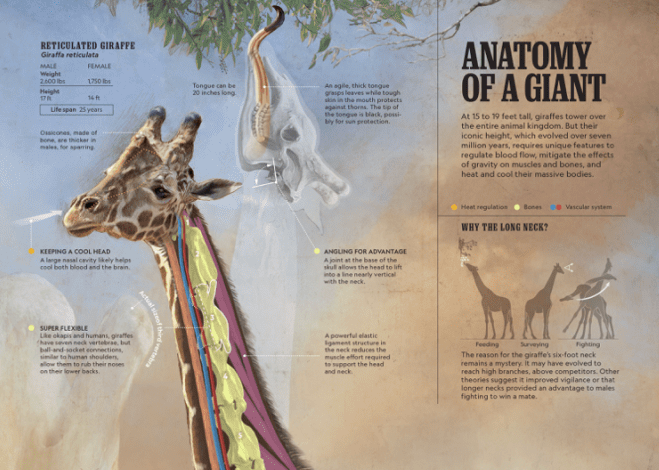
What’s the global data journalism community tweeting about this week? Our NodeXL #ddj mapping from October 14 to 20 finds National Geographic illustrating the unique anatomy of giraffes, The Washington Post explaining the process of building a 3D interactive animation on autonomous driving, The Pudding creating a fun pub crawl generator, and Robert Kosara investigating how people read pie charts.

Data Journalism

GIJN’s Data Journalism Top 10: Fall Foliage, Housing Data, Knife Crimes, Charts vs. Text

What’s the global data journalism community tweeting about this week? Our NodeXL #ddj mapping from October 7 to 13 finds The New York Times tackling the topic of auto emissions as a significant climate problem, The Washington Post mapping the colors of America’s fall foliage across the nation, St. Louis Post-Dispatch sharing its newsroom process in data transparency, and Nicholas Strayer offering a tutorial to build your own cool resume using R.

Data Journalism

GIJN’s Data Journalism Top 10: Zero Privacy, Hurricane Maps, Water Stress, Russian Judges

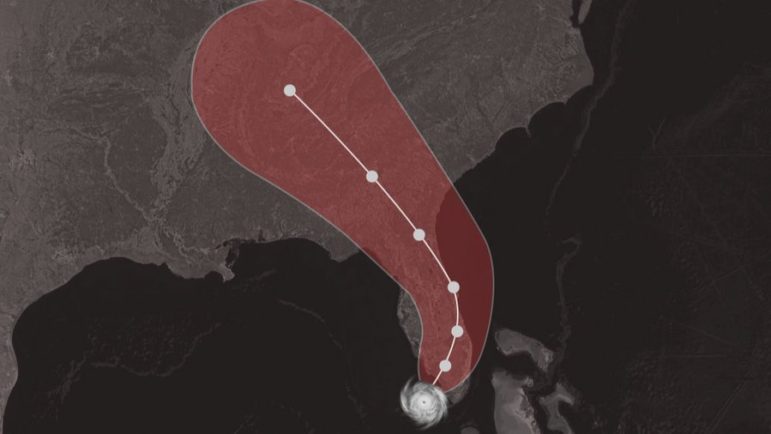
What’s the global data journalism community tweeting about this week? Our NodeXL #ddj mapping from August 26 to Sept 1 finds The New York Times examining the massive amount of digital trackers that follow an individual’s web activity, The Washington Post looking at the stress on global water resources, Data Visualization Society announcing the first #VizRisk challenge winners, and Datajournalism.com sharing tips on how journalists can learn to code.

Data Journalism

GIJN’s Data Journalism Top 10: Tarantino’s Swearing, TheyDrawIt Tool, Climate Crisis

What’s the global data journalism community tweeting about this week? Our NodeXL #ddj mapping from August 5 to 11 finds Spiegel Online analyzing the typical features in Quentin Tarantino’s films, MU Collective releasing an interactive “TheyDrawIt” tool to engage and educate readers, and the conversation on the climate crisis heating up — with 101 East Al Jazeera looking into Cambodia’s deforestation, Neue Zürcher Zeitung analyzing Switzerland’s forest fires, and the Financial Times digging into the impact of jet streams on the climate.

Data Journalism

GIJN’s Data Journalism Top 10: Visualizing Climate Change, Numbers from Phrases, Democratic Donors, Moscow Money

What’s the global data journalism community tweeting about this week? Our NodeXL #ddj mapping from July 29 to August 4 finds a number of articles related to the climate crisis, including the BBC’s piece on tree planting and its interactive tool on temperatures across the world, as well as Alberto Cairo’s blog post on misleading charts created by climate deniers. We also found useful tips and tools: a data GIF maker by Google News Initiative, Datajournalism.com’s strategies for teaching data journalism, and Paul Bradshaw’s tutorial on how to extract numeric data from phrases.

News & Analysis

GIJN’s Data Journalism Top 10: Aging Wimbledon, Must-Read DataViz, Bad Charts, German Opera

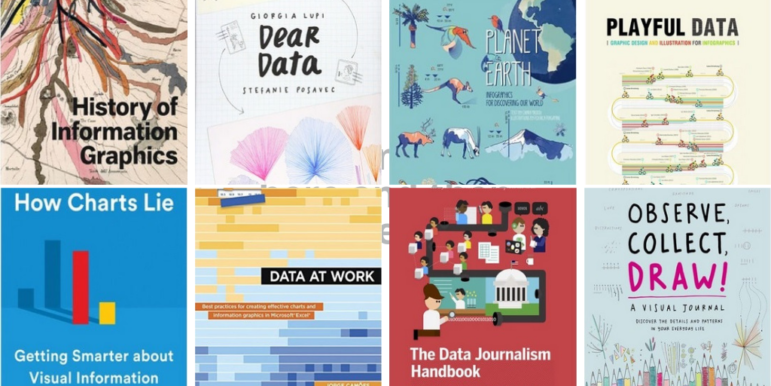
What’s the global data journalism community tweeting about this week? Our NodeXL #ddj mapping from July 15 to 21 finds Information Is Beautiful’s sharing its gallery of must-read data visualization books, Datajournalism.com highlighting pitfalls in creating charts, the FT analyzing the age of Wimbledon players, and WDR scrutinizing Germany’s opera repertoire.