Register for #GIJC25
November 20, 2025 • 09:00
-
day
days
-
hour
hours
-
min
mins
-
sec
secs

Accessibility Settings

color options

monochrome muted color dark

reading tools

isolation ruler

Language

English

2858 posts

Data Journalism

Data Journalism Top 10: Ranking Halloween Candy, Formula 1, Canadian Prisons, COVID-19 Indoors

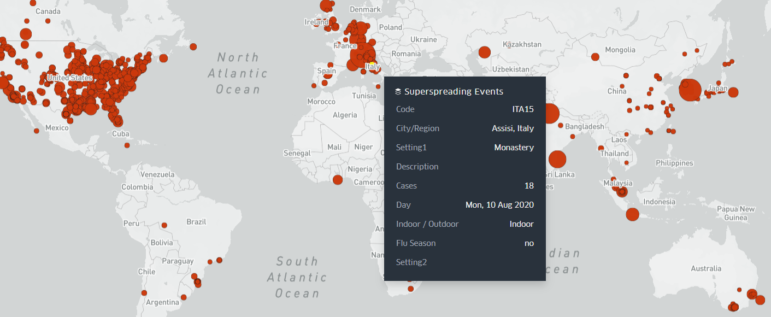
Gearing up for Halloween? You’ll want to refer to our NodeXL #ddj mapping from October 19 to 25. We found FiveThirtyEight’s ultimate Halloween candy ranking from the archives to please the palates of finicky trick-or-treaters. This edition also includes The Economist’s mathematical model to determine whether Formula 1 racing success depends on its driver or the car engineer; The Globe and Mail examines bias in Canada’s prison system; and El Pais looks into how to reduce the probability of COVID-19 transmissions indoors.

From Kyrgyzstan to Peru: A Record 20 New Members Join GIJN

At a time of growing intolerance toward independent media and free expression, we at GIJN are particularly pleased to announce that our Board of Directors has approved a record 20 new member organizations from 14 countries. GIJN now has 203 member groups in 80 countries.

How They Did It News & Analysis

How They Did It: Tracking Down a Rwandan Genocide Suspect

A French freelance journalist tracked down a man accused of being involved in Rwanda’s 1994 genocide. Here’s how French journalist Théo Englebert delved into the eight-month investigation, including his top tips for finding someone who wants to disappear. 

News & Analysis

Tracking the Superspreader Events Driving the COVID-19 Pandemic

“Superspreading events” have emerged as major drivers of the COVID-19 pandemic. While available data on these events is limited, new information — including an interactive database of 1,500 events — offers reporters the means to map the patterns of past coronavirus outbreaks, and to evaluate the risks of planned gatherings.

Data Journalism

Data Journalism Top 10: Visualizing Hurricanes, Predicting Wildfires, Social Media Algorithms, Trump Loyalty Index

How does climate change increase the likelihood of weather extremes? Our NodeXL #ddj mapping from October 12 to 18 finds ProPublica examining how the warming global climate exacerbates wildfire activity, and designer Will Chase visualizing some of the most destructive hurricanes with an interactive wheel graphic. The Financial Times is summarizing key trends of the pandemic using charts, maps, and graphics, while The Markup announced its latest project looking into the black box algorithms of social media platforms.

News & Analysis

Double Exposure: 5 Investigative Documentaries to Watch

The Double Exposure film festival showcases the creative work of reporters and filmmakers who pursue investigations in the public interest. From a film shot in Wuhan’s hospital wards to an investigation into the murder of a member of North Korea’s ruling family, here are five of the top investigative documentaries featured at this year’s festival.

Data Journalism

How Data Journalists Can Use Anonymization to Protect Privacy

For data journalists there is a balancing act between publishing information vital to a story and protecting the person behind that information. Vojtech Sedlak explains the pitfalls and offers tips on how journalists can protect the people that feature in the data without compromising the story.