Photo: Shutterstock
GIJN has collected and organized resources on using data in investigative reporting.
We begin with the best general training materials and then dive into the most useful tools. The entries in each category are alphabetical, with links and brief descriptions.
Table of Contents
Data Journalism Training Courses
Getting Data — Using Open Records Laws
Tools for Scraping, Cleaning, and Prepping Data
We welcome suggestions for expanding this resource. Please write to us here.
Acknowledgements: This GIJN resource was prepared by GIJN staff and the Investigative Reporting Workshop, based at the School of Communication at American University, with contributions from Helena Bengsston, John Bones, Fred Vallance Jones, Madeleine Davison, Flor Coelho, Jennifer LaFleur, and Brant Houston.

Reporter’s Guide to Investigating Cryptocurrency

Tipsheet on Partnering with Civil Society Organizations and Non-Governmental Organizations

AI Accountability Reporting Guide

Guide to Mapping Analysis Using QGIS
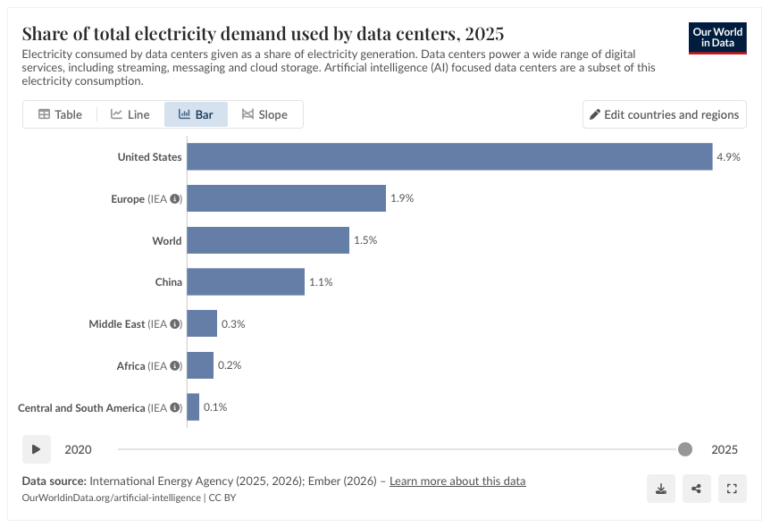
Global Data Center Energy Use, US Strike on Iran School, Russia’s Security Service Leaks, Portugal’s Ancient Trees

How to Make Investigations Matter More: A Q&A with the Authors of ‘The Guide to Impact Journalism’
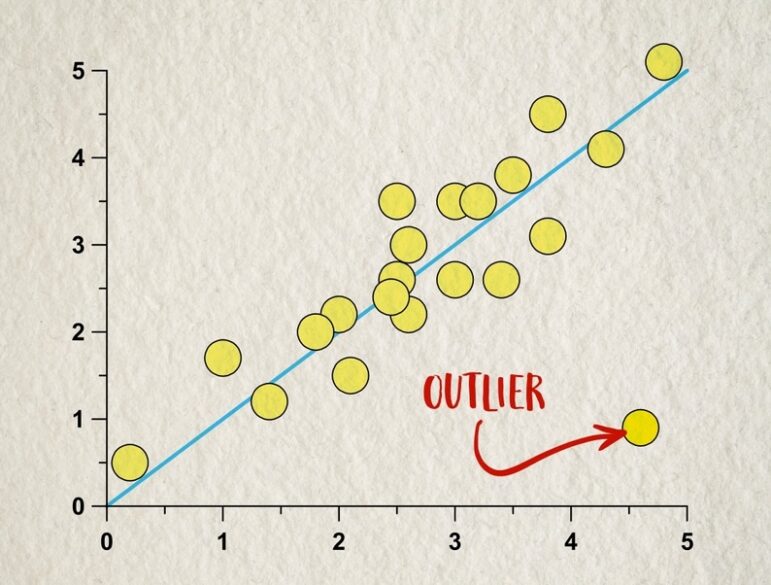
The Power of ‘Positive Deviant’ Data Investigations: How Good Outliers Can Expose Systemic Misconduct or Policy Failure

How a WhatsApp Community Is Bringing India’s Data Storytellers Together

This work is licensed under a Creative Commons Attribution-NoDerivatives 4.0 International License
Republish our articles for free, online or in print, under a Creative Commons license.
Republish this article
This work is licensed under a Creative Commons Attribution-NoDerivatives 4.0 International License
Read Next
Data Journalism Top 10
Global Data Center Energy Use, US Strike on Iran School, Russia’s Security Service Leaks, Portugal’s Ancient Trees
This latest Top 10 in Data Journalism column also highlights rising drug-related deaths in Berlin, heatwave fatalities in Europe, and Hong Kong’s rapidly aging population.
Distribution & Promotion
How to Make Investigations Matter More: A Q&A with the Authors of ‘The Guide to Impact Journalism’
In investigative journalism, many newsrooms have begun implementing an “impact strategy.” How can they do better and what is the goal?
Reporting Tools & Tips
The Power of ‘Positive Deviant’ Data Investigations: How Good Outliers Can Expose Systemic Misconduct or Policy Failure
One often overlooked approach for accountability reporting involves side-by-side comparisons between successful and failing institutions with near-identical resources.
Data Journalism
How a WhatsApp Community Is Bringing India’s Data Storytellers Together
Recently, more than 400 people gathered in the Indian city of Bengaluru for VizChitra 2026, a conference on data visualization and storytelling — but that is only a small part of the story.