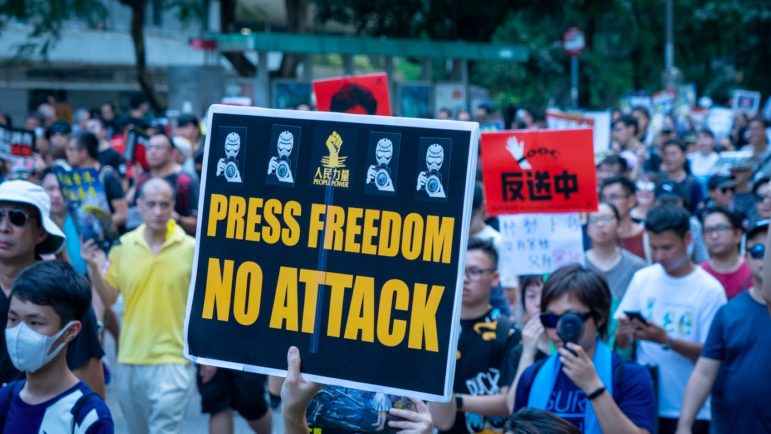
Register for #GIJC25
November 20, 2025 • 09:00
-
day
days
-
hour
hours
-
min
mins
-
sec
secs

Accessibility Settings

color options

monochrome muted color dark

reading tools

isolation ruler

Posts

308 posts

Data Journalism

Data Journalism Top 10: Atlas of Emotions, Carbon Recyclers, Football Long Shots, COVID-19 Endgame, Mister Rogers’ Cardigans

To fight climate change, we need to protect sea life. Whales, plankton, and seagrasses have a key impact on the Earth’s carbon cycle. Our NodeXL #ddj mapping from to April 5 to April 11, which tracks the most popular data journalism stories on Twitter each week, found a piece by Reuters Graphics explaining how these species interact underwater as well as capture and transform carbon. In this edition, we also feature an atlas of emotions by Google Arts & Culture, a look at the COVID-19 endgame by the Financial Times, and some great board games to inspire data visualization enthusiasts.

Hong Kong protest for press freedom

News & Analysis

The Economic Costs of Curbing Press Freedom

Researchers have found evidence that attacks on press freedom — such as jailing journalists, raiding their homes, shutting down printing presses, and using libel laws to thwart reporters — have measurable effects on a nation’s economic growth.

Case Studies Reporting Tools & Tips

How Reporters Exposed the Spies Implicated in the Navalny Poisoning

No law enforcement agency announced any criminal investigation into the attempted murder of Russia’s leading opposition figure, Alexey Navalny, after he was poisoned with a chemical weapon in Russia last year. Instead, investigative journalists stepped forward. In a GIJN webinar, journalists from Bellingcat and Russia’s The Insider explained how, and why, they used black market data to help expose the true culprits behind that attack.

Data Journalism

How the COVID-19 Pandemic Has Shaped Data Journalism

As COVID-19 cases surged throughout the past year, so did data visualizations. Data-minded scientists, journalists, health care providers, and philanthropists discussed how the pandemic and data journalism have shaped each other at a US symposium, and shared new visualization tools.

Data Journalism

Data Journalism Top 10: Global Protests, Baseball Returns, 17-Year Bugs, High-Tech COVID Masks, Vaccine Inequality

The consequences of the global pandemic, including job crises and deepening inequalities, have ignited a new wave of protest movements over the past year. But over the past decade, there were at least 900 protest events that each drew more than 10,000 participants, according to a project by Al Jazeera’s graphics team. Our NodeXL #ddj mapping from March 29 to April 4, which tracks the most popular data journalism stories on Twitter, also features an analysis of migration trends by The Financial Times, a story about the next generation of face masks by The Wall Street Journal, and a remarkable sound visualization of COVID-19’s impact in Switzerland using a music box.