
Image: Shutterstock
Tipsheet for Using Ocean Data in Your Investigations
Read this article in
How much ocean acidification has occurred in the past century? How long is the anchorage waiting time for container ships at the port of Shanghai? How many gallons of chemicals were spilled in US ocean waters last year?
Those, and many other questions about what happens on the sea surface, underwater, in ports, and on coasts, can be answered anytime thanks to the vast amount of ocean data that is available online.
The New York Times visual investigations team took advantage of shipping data, corporate records, and satellite imagery to track luxury cars that eventually ended up in Kim Jong-un’s hands, in violation of US trade sanctions on North Korea. The journalists and the Center for Advanced Defense Studies followed shipments from Europe to East Asia.
These were some of the stories presented at the March 12, 2024 webinar on How To Use Ocean Data for Journalism, hosted by the Pulitzer Center as part of its Ocean Reporting Network (ORN) initiative. Panelists at the event included Alexandra Talty, ORN fellow; Alexander More, scientist at Harvard University and director of the research center ECHO; Georgios Hatzimanolis, head of global communications and branding at Kpler, a platform for global trade intelligence; and Jean-Charles Gordon, ship tracking director at Kpler.
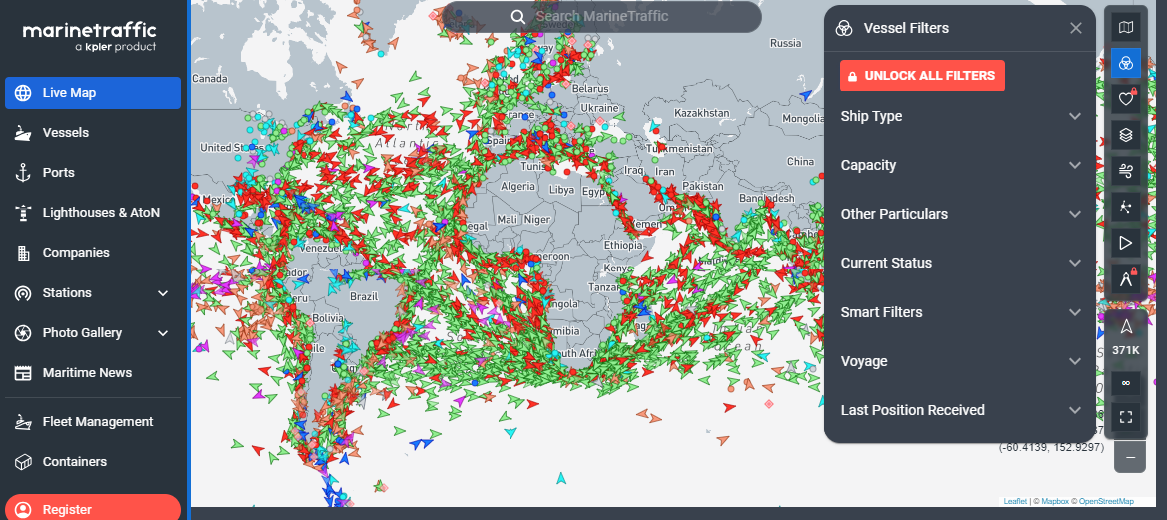
Kpler, a platform for global trade intelligence, produces MarineTraffic, which tracks global vessel and ownership data. Image: Screenshot, Kpler
Tips for Covering Ocean-Related Stories
- Ocean, fishery, and climate databases are often built with commercial rather than informational purposes, which can make them at times overwhelming, incomplete, and hard to navigate. So, experts recommend journalists collaborate with scientists and initiatives that have a deep understanding of the ocean and that provide data services to newsrooms. One example, represented on the panel, is ECHO, a research center for climate, ocean, and health solutions, which connects journalists to climate data sources and scientists and provides some training and workshops.
- Define your story clearly, so you can identify what information you need and make clear requests to the correct data sources.
- Look for transnational perspectives in your stories, since oceanic activities are strongly related to international trading and global commitments to protect underwater life. It will also help if you collaborate with colleagues from other countries to achieve that global view.
- Double-check your findings and verify the data with more than one source, for example, by utilizing two different satellite imagery tools or datasets.
- Scrutinize data quality. Identify a reference point to help you check if the data you are analyzing is coherent. Talk to experts about any discrepancies you find in data to understand if that means a pattern, a story to tell, or an error in the data.
- When there is little data about topics like new industries, try creating your own databases from various sources, like satellite imagery, company ownership registries, ocean health indicators (temperature, acidification, salinity), etc. Team up with academics or NGOs and file FOIA requests when necessary.
- Overlap GIS data on commercial or industrial activities in the oceans to protected areas, to determine whether these are being protected.
Key Resources
- The US National Oceanic and Atmospheric Administration (NOAA) data collections, which include ocean geography and depth, world oceans’ temperature, salinity, nitrates, phosphates, etc., marine pollution, fisheries, among others.
- The European Environment Agency’s Datahub, which contains 68 datasets on water, seas, and coasts, as well as others related to biodiversity and transportation.
- Climate Reanalyzer, which provides daily data on sea surface temperature and sea ice extent.
- Historical global surface ocean acidification indicators from the years 1750 to 2100 (projected), from the Ocean Carbon and Acidification Data Portal.
- Satellite imagery platforms for analyzing localized ocean activity and identifying changes in it. Some examples are Google Earth and the NOAA satellite collection.
- To dig into records of shipping companies or others related to your ocean-based reporting, try databases like EDGAR in the US, GuideStar, for nonprofits, UK Companies House, or Sayari, which scrapes worldwide data to show company networks.
- To search databases about specific industries related to the ocean, try groups such as Phyconomy, a database of seaweed-focused organizations.
- For tracking marine vessels, look for databases on AIS (Automatic Identification System), the technology that ship transceivers are mandated to use. One good example of this is MarineTraffic, by Kpler, which provides data on current and former vessel owners, port calls, current and backwards operation, different types of vessels, HD photos, ports, lighthouses, companies, etc., and allows the creation of personalized fleet to keep track on groups of vessels. It is also possible to directly contact Kpler for information from their private data tool on trade and cargo (analytics, routes, load, buyers and sellers, sanctions, management or operational risks, compliance, masqueraded operations). There are other tracking resources, such as VesselFinder and ShipFinder. (See also GIJN’s tipsheet for Tracking Ships at Sea.)
- Trade trackers: Comtrade, UN offers detailed data on global trade with estimates of world seaborne trade in real time. Panjiva provides the ability to track shipments to individual companies.
- The Ocean Reporting Toolkit, is a list of data sources organized by topics: satellite imagery, vessel ownership and tracking, illegal, unreported, and unregulated fishing, money trails and supply chains, deep sea mining, legal data, academic sources and reporting guides.
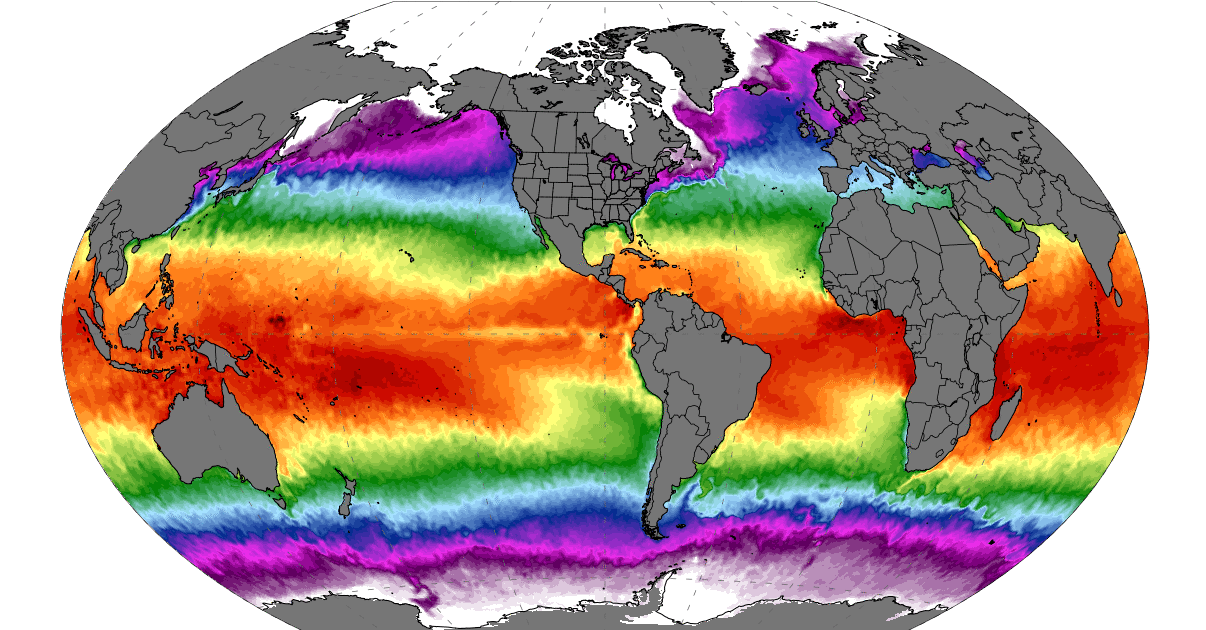
A sea surface temperature graph produced by Climate Reanalyzer, which provides daily data on sea surface temperature and sea ice extent. Image: Screenshot, Climate Reanalyzer
Here are some of the themes that newsrooms can dig into with the use of ocean data:
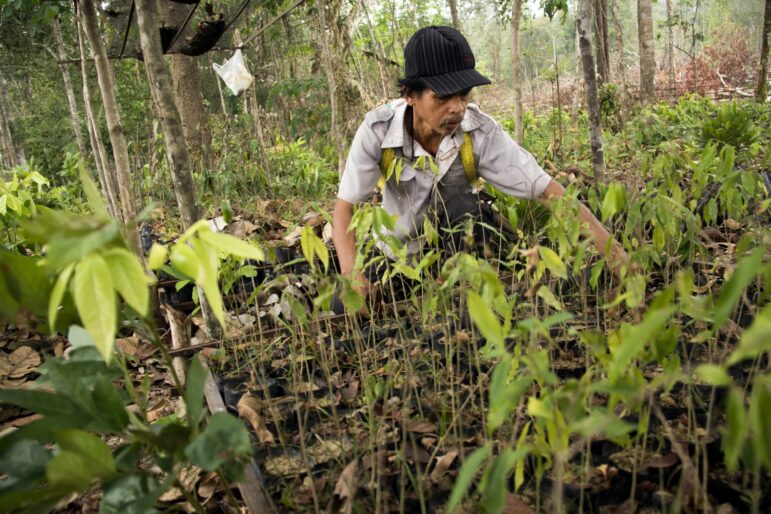
- New industries or practices related to species that live in the oceans, like the nascent seaweed industry in the United States, that Alexandra Talty is investigating for Civil Eats. During ORN’s webinar, she described how she is building a map of all seaweed farms in the US, tracking the money behind the industry, profiling its key actors, and investigating its probable impact on other marine animals and marine-protected areas.
- Innovative angles about the impact on the ocean from phenomena like climate change (beyond sea-level rise) or global trade, which can emit massive amounts of greenhouse gasses, as well as deposit black carbon and dust on the seas from ships and vessels.
- Illegal fishing. “There is an increasing use of maritime data by journalists, but the only story that I really think needs to be covered more is illegal fishing. There’s definitely not enough being spoken about that and it’s having huge environmental impacts,” Kpler’s Georgios Hatzimanolis said at the webinar. He also suggested investigating the humanitarian side of illicit fishing, because it can deplete local fisheries and force disadvantaged workers to stay on fishing vessels for years at a time, sometimes under illegal or even deadly labor conditions..
- Evolving Arctic or polar issues, such as the new shipping lanes being opened in the Arctic due to climate change and warming oceans. Look into how those voyages might be forcing the ice to melt faster and bring other unintended consequences.
- Port and maritime operations, which can include looking at corporate insurance claims as well as how vessels and ships actually operate in the sea and whether they respect perimeters and boundaries.
- Possible greenwashing by companies or industries that claim to be part of the blue economy (the sustainable use of ocean resources for economic growth). One way to begin investigating this involves looking at the sustainability funds created by multinational corporations to meet their carbon neutral goals, which have a lack of transparency and little oversight. (For more on the growing business of greenwashing, check out GIJN’s Reporter’s Guide to Investigating Carbon Offsets.)
You can watch the entire webinar on YouTube below.
 Miriam Forero Ariza is a freelance journalist and data journalism expert, with wide experience in coordinating collaborative investigations, communications, and academic projects. She led Colombiacheck.com, the first fact-checking media in Colombia, and Poderopedia.co.
GIJN’s Guide to Investigating Sea Level Rise
How to Track Ships: GIJN’s Latest Resource Round-Up
Reporter’s Guide to Investigating Carbon Offsets

Video Resources for Mapping, Satellites, Storytelling, Testing, Tracking, and Disinformation
How We Turned Years of Reporting on the High Seas into a Podcast: Tips from Ian Urbina
How an Award-Winning, Cross-Border Project Investigated on the Open Ocean
‘Pacific Plunder’: Using Local Partners to Investigate in Remote Locations

Audacious Tricks to Track Smuggled Goods, Identify Illegal Fish, and Interview Reluctant Sources

This work is licensed under a Creative Commons Attribution-NoDerivatives 4.0 International License
Republish our articles for free, online or in print, under a Creative Commons license.
Republish this article
This work is licensed under a Creative Commons Attribution-NoDerivatives 4.0 International License
Read Next
News & Analysis
How We Turned Years of Reporting on the High Seas into a Podcast: Tips from Ian Urbina
The Outlaw Ocean Project — a nonprofit journalism organization that reports on the “watery two-thirds” of our planet — used material from several years of investigations on the high seas to create a new, seven-part podcast.
Case Studies News & Analysis
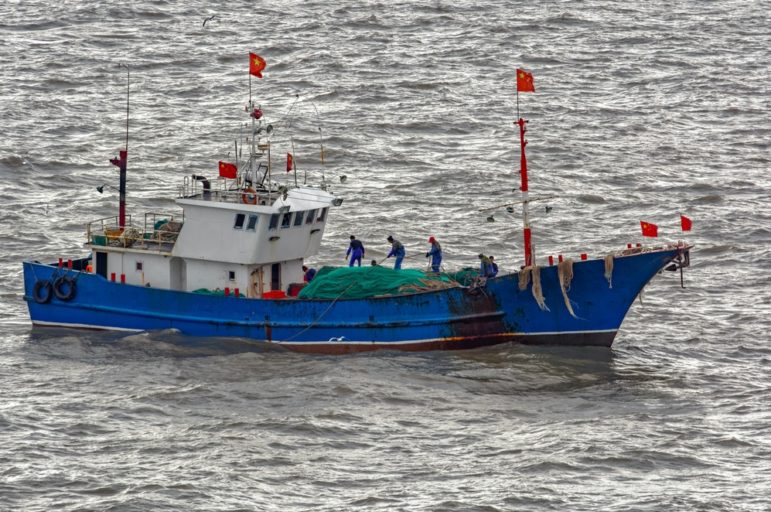
How an Award-Winning, Cross-Border Project Investigated on the Open Ocean
Fourteen newsrooms and independent journalists from 13 countries collaborated on the Oceans, Inc. project, to uncover stories about illegal fishing and forced slavery on the South China Sea and the oceans near Antarctica. Their cross-border reporting won the 2022 SOPA Award for Excellence in Reporting on the Environment.
Resource
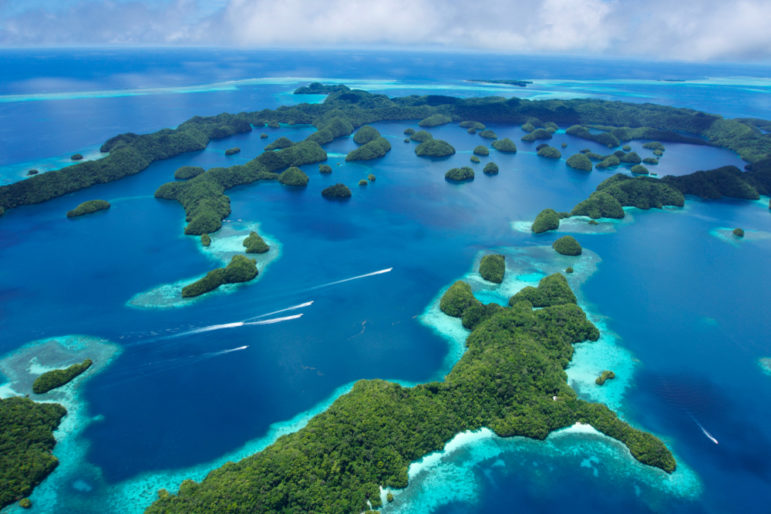
‘Pacific Plunder’: Using Local Partners to Investigate in Remote Locations
A major collaboration between the Guardian Australia and more than a dozen contributing Indigenous journalists — supported by the Judith Neilson Institute — has generated hundreds of relevant stories, including several investigations, on small South Pacific nations in the past two years.
GIJC23
Audacious Tricks to Track Smuggled Goods, Identify Illegal Fish, and Interview Reluctant Sources
The team from Mission Investigate at Swedish Public Television (SVT) have used innovative and sometimes audacious tricks and techniques to boost their investigations.