Data Journalism Top 10: Tracking Russia’s War, Ukraine’s Refugees, COVID-19 Polarization, Clothing Waste, Banh Mi
Read this article in

Step-By-Step Guide for Journalists on the Basics of Google Sheets

Tipsheet for Using Ocean Data in Your Investigations

No Coding Required: A Step-by-Step Guide to Scraping Websites With Data Miner

GIJC23 – The Future of Data Journalism: New Analytical Tools, Data Visualization, and AI
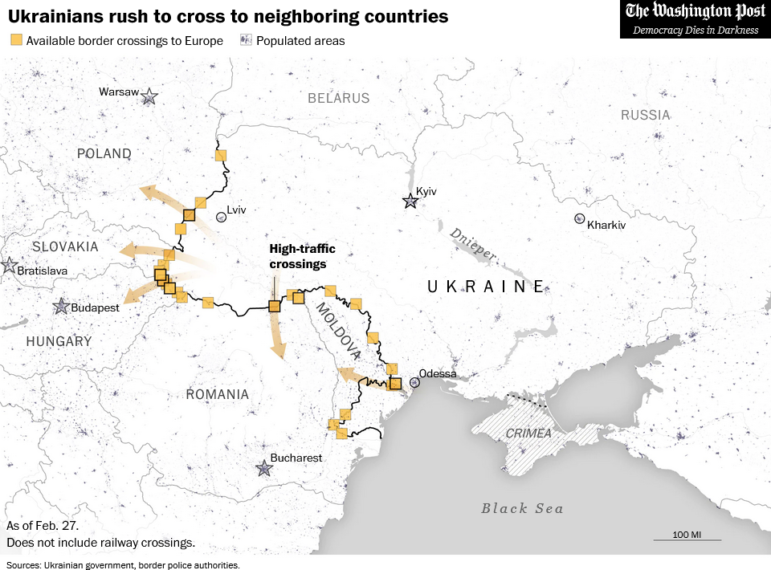
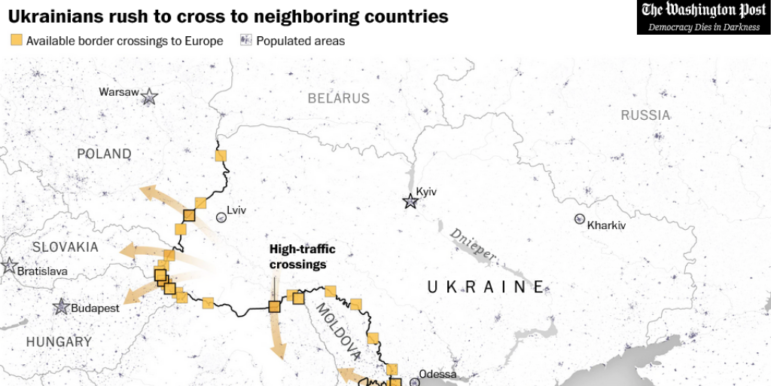
More than a million refugees have left Ukraine in the last week. Image: Screenshot of a map by The Washington Post
Russia’s attack on Ukraine has triggered an exodus of people seeking safety in neighboring countries. The Washington Post shows what the long, wrenching waits at Ukraine’s borders look like. Our weekly NodeXL curation of the most popular data journalism stories on Twitter also highlights Vox’s explainer on vaccine hesitancy in the United States, a look by the Guardian at how the coronavirus pandemic has changed life in the United Kingdom, and a map that charts the price of the Vietnamese staple of bánh mì in Australia’s second-largest city, created by The Age.
Mapping Russia’s Invasion into Ukraine
Newsroom data teams from Germany to Brazil, and from Taiwan to Qatar, have been busy producing maps and trackers about Russia’s war on Ukraine, with many focusing on mapping Russian military strikes. Datawrapper’s Lisa Charlotte Muth posted a long tweet thread linking to articles from more than 40 newsrooms about the conflict. It includes graphics from The Telegraph, El Mundo (Spanish), Apple Daily (Mandarin), and DerStandard (German). For more, see Datawrapper’s Data Vis Dispatch.
Fleeing the War
More than one million refugees have left Ukraine in the week since Russia’s invasion, according to data from UNHCR, the UN refugee agency. And the number of Ukrainians expected to flee the country could reach four million in the coming weeks, from a population of some 44 million. The Washington Post visualized the border crossings and provided a glimpse of the exodus of people fleeing the conflict using satellite images.
COVID-19 Polarization
Vaccines have changed the course of the coronavirus pandemic. But in the United States, despite evidence that the death rate is higher in unvaccinated patients than vaccinated people, a notable minority have chosen not to have the shot. And according to data from the Kaiser Family Foundation, most unvaccinated Americans are conservative Republicans. Using 15 charts and interviews, Vox produced a compelling explanation of the vaccination gap between conservatives and liberals, revealing that misinformation and disbelief over the seriousness of the pandemic are two of the reasons behind vaccine hesitancy.
Lifestyles and the Pandemic
After more than two years living through the COVID-19 pandemic, people across the globe have had to adapt to different lifestyles: working from home, wearing masks, self-isolating, organizing smaller gatherings, attending a million Zoom calls… The Guardian examined how the lives of Britons have changed due to the pandemic, and charted these new habits. Its analysis found that foot traffic in shops and air travel have yet to recover to their pre-pandemic levels, while subscriptions to streaming services have seen substantial growth.
Vaccine Mandates
As the global workforce starts to return to offices, companies are creating internal COVID-19 policies to safeguard the health of employees and minimize disruption. The New York Times surveyed more than 500 top corporations with international employees, scouring their websites and public filings to find out if these firms require employees to be vaccinated or tested regularly, and the consequences of not adhering to company policy.
Stressed Parents
Just as classrooms were starting to return to near-normal in late 2021, the highly transmissible omicron variant left US parents scrambling for alternatives as schools again shut down. The Pew Research Center, a Washington, DC, think tank, surveyed working parents about their child care arrangements during the pandemic last month. Half of the respondents said they had found it at least “somewhat difficult” to handle child care responsibilities recently, while a substantial share of parents with young children said it would be very difficult for them to find backup care if needed again.
Best Value Bánh Mì
Vietnam’s famed sandwich, bánh mì, has gone from a street food staple to a favorite food around the world. It is a baguette filled with meat, pate, coriander, spring onion, cucumber, carrot, and chili, and is usually pretty cheap in its country of origin. But how much does it cost Australians? Daily newspaper The Age compiled and mapped the prices of bánh mì from more than 200 establishments across Melbourne to find the best value for your Australian dollar.
Clothing Waste
According to the United Nations Environment Programme, fashion accounts for up to 10% of global carbon emissions, more than international flights and shipping combined. And clothing is increasingly being made from polyester and other synthetic fibers, which are a prime source of microplastic pollution. Bloomberg looked at the life cycle of garments and the impact of fast fashion’s overproduction on the environment. There is a running counter at the bottom right corner of the page tracking how many pieces of clothing have been discarded in the time you spent reading the article. Graphics journalist Rachael Dottle shares details about the piece in this tweet thread.
Mother Tongue
In conjunction with World Mother Language Day, Al Jazeera highlighted the world’s most spoken languages and most common scripts. The team also asked people from around the world to share popular idioms and their meanings. Find out what “they’re not your onions” in French means, or what “a watermelon catches color from other watermelons” in Urdu signifies.
Data Journalism Starter Guide
Nicki Camberg, who previously worked on the COVID Tracking Project, put together a resource guide for early career data journalists. She lists sites that consistently produce cool data stories, data journalists and data teams to follow on Twitter, data newsletters, data conferences, and tips for navigating the data journalism world. Also, check out this list of free data tools and resources compiled by economist Jon Schwabish.
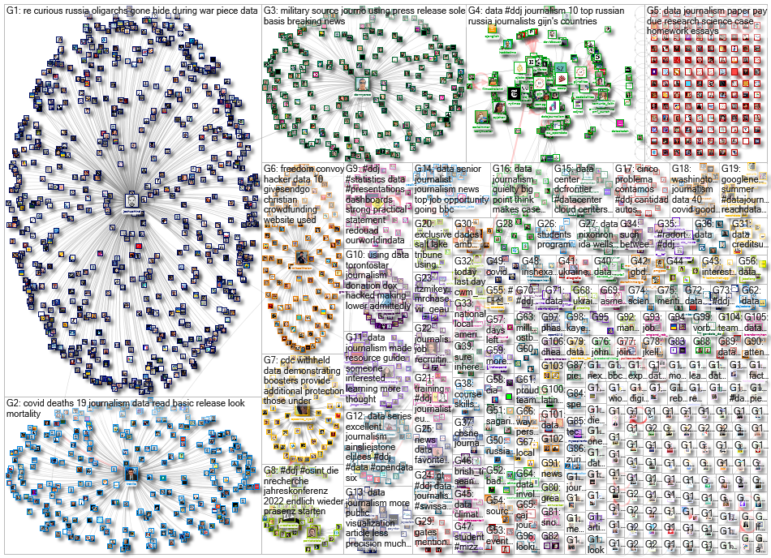
Thanks again to Marc Smith and Harald Meier of Connected Action for gathering the links and graphing them. The Top Ten #ddj list is curated weekly.
 Eunice Au is GIJN’s program manager. Previously, she was a Malaysia correspondent for Singapore’s The Straits Times, and a journalist at the New Straits Times. She has also written for The Sun, Malaysian Today, and Madam Chair.
For a look at NodeXL’s mapping on #ddj and data journalism on Twitter, check out this map.
Step-By-Step Guide for Journalists on the Basics of Google Sheets
Tipsheet for Using Ocean Data in Your Investigations
No Coding Required: A Step-by-Step Guide to Scraping Websites With Data Miner
GIJC23 – The Future of Data Journalism: New Analytical Tools, Data Visualization, and AI

From Data to Storytelling: Concept and Design Tips from the Financial Times’ John Burn-Murdoch

How Middle Eastern Data Outlets Use Data to Challenge Narratives and Advance Accountability

Test Your Data Visualization Skills With GIJN’s Latest Quiz

‘Shining a Light Where There Are Shadows’: Latin American Outlets Innovating With Data

This work is licensed under a Creative Commons Attribution-NoDerivatives 4.0 International License
Republish our articles for free, online or in print, under a Creative Commons license.
Republish this article
This work is licensed under a Creative Commons Attribution-NoDerivatives 4.0 International License
Read Next
Data Journalism
From Data to Storytelling: Concept and Design Tips from the Financial Times’ John Burn-Murdoch
The chief data reporter for the Financial Times discusses how he considers the use of text, color, and annotation to aid visual storytelling through charts and graphics.
Data Journalism MENA Focus Week
How Middle Eastern Data Outlets Use Data to Challenge Narratives and Advance Accountability
Data journalism in the Middle East has been driven by organizations that have produced collaborations and projects that combine innovative techniques with nuanced local knowledge.
Data Journalism Teaching & Training
Test Your Data Visualization Skills With GIJN’s Latest Quiz
GIJN Turkish Editor and data journalism instructor Pinar Dag is back with another quiz to test your knowledge of data visualization.
Data Journalism LATAM Focus News & Analysis
‘Shining a Light Where There Are Shadows’: Latin American Outlets Innovating With Data
Data journalism is helping outlets across the region carry out innovative projects that reveal the stories hidden in large volumes of data.