
Data Journalism Top 10: Chocolate Box Audit, Vaccine Lineup, COVID-19 Antigen Testing, Scraping Is Not a Crime
Read this article in
As the United Kingdom begins its rollout of the first COVID-19 vaccine this week, the world is watching with bated breath. Our NodeXL #ddj mapping from November 30 to December 6 found Bloomberg tracking the development of nine of the most promising vaccines around the world, The New York Times creating an interactive for Americans to establish where they are in the line before they can get vaccinated, and Spain’s El Pais examining the advantages of using antigen testing for COVID-19 infections. Meanwhile, ITV News’ Stephen Hull did a fun data analysis of the assorted chocolates in a Quality Street tin.
Auditing Chocolate Boxes
Have you ever bought an assorted box of chocolates, only to find that your favorite kind disappeared faster than the others? Stephen Hull, head of digital at British television network ITV News, was curious to see whether the different types of chocolates in a Quality Street chocolate box were equally distributed. He discovered a very unequal representation of each. The consumer rights organization Which? did a similar analysis two years ago. Scroll through the comments following Hull’s tweet for more humorous chocolate “audits.”
Where Do You Fall in the Vaccine Lineup?
How many people are ahead of you in the line for a COVID-19 vaccine? The New York Times created an interactive for those living in the US to find out just how many people take priority over them and where they fall in the line. The results are estimated based on age, county of residence, profession, and if an individual has any pre-existing health conditions. Read more on the debate on who should get the vaccine first here.
Tracking the Vaccine Rollout
Bloomberg is tracking nine of the most promising COVID-19 vaccines around the world and visualizing their development timelines in one chart: from the trial stage to when they become available to the public. The chart includes data on trial size, doses required, optimum storage temperature, and efficacy. The reporters also identified more than 80 agreements worldwide by governments to secure vaccines for their people, with about 7.95 billion doses already allotted. Bonus article: the BBC explains how vaccines work and asks whether they will “give us our old lives back?”
Scraping Is Not a Crime
In July, we mentioned that The Markup filed an amicus brief in the Supreme Court in the United States arguing that an overly-broad interpretation of the Computer Fraud and Abuse Act could threaten the media’s ability to gather news, particularly in using automated data collection processes such as scraping. Now, months later, the Court is hearing the case, and the team at The Markup is spreading the word via the hashtag #ScrapingIsNotACrime and by wearing corresponding t-shirts. Read the brief here.
Testing for COVID-19
Spanish-language daily El Pais examined the use of different types of tests when determining whether a person is positive for COVID-19. The newspaper explains the advantages of using antigen tests — which are fast and cheap — and which can speed up detection of people in the contagious phase, and thus help reduce the opportunities for new infections.
https://twitter.com/achisto/status/1335379700789751810
Using Wikipedia for Data Journalism
Wikipedia, the free online encyclopedia, is an enormous repository of information, with more than 53 million articles in 314 languages. Freelance writer and researcher Monika Sengul-Jones offers ideas on how data journalists can discover stories by digging for hidden data on the site.
Computation + Journalism Symposium 2021
The 2021 Computation + Journalism Symposium, co-hosted by Northeastern University and the Brown Institute for Media Innovation, will be held virtually. Researchers and journalists are invited to submit either a single paper proposal or suggest an entire session. Proposals can cover the “backstory” to a novel work of journalism, a tool or method that could support new kinds of storytelling, or the description of a significant collaboration between journalists and some other field. Deadline: January 19, 2021.
Data Citizens: A New Lecture Series
The University of Miami’s Institute for Data Science and Computing is launching a new, virtual lecture series called “Data Citizens.” It will showcase panels and in-depth talks by top-level experts in the field of data science. Topics will include the role of data science in fields like psychology, climate change, healthcare, art, neuroscience, and ethics. The next lecture, which is free and open to public, features scholar and author Dr. Deborah Stone, and will be held today (Thursday, December 10) at 4 pm EST.
https://twitter.com/AlbertoCairo/status/1334528539232710657
JSK Data Reporting Grant Winners
The John S. Knight Journalism Fellowships at Stanford University and Big Local News, a project of the Stanford Journalism and Democracy Initiative, awarded $191,500 in funding to 11 projects worldwide which will report data-driven stories related to the COVID-19 pandemic. See the winners and their project ideas here.
COVID-19 Data Viz and Data Journalism Compilation
Data analyst Hassel Fallas put together a very personal list of her favorite visual and data journalism projects to help people better understand the coronavirus pandemic and the SARS-CoV-2 virus.
Thanks again to Marc Smith and Harald Meier of Connected Action for gathering the links and graphing them. The Top Ten #ddj list is curated weekly.
 Eunice Au is GIJN’s program manager. Previously, she was a Malaysia correspondent for Singapore’s The Straits Times, and a journalist at the New Straits Times. She has also written for The Sun, Malaysian Today, and Madam Chair.
For a look at NodeXL’s mapping on #ddj and data journalism on Twitter, check out this map.

Reporter’s Guide to Investigating Cryptocurrency

Tipsheet on Partnering with Civil Society Organizations and Non-Governmental Organizations

AI Accountability Reporting Guide

Guide to Mapping Analysis Using QGIS

How Data Journalism Is Changing the Face of Africa

Data-Driven Journalism: Roundup of Recent Standout Stories
Data Journalism Top 10: Everest’s Deadly Legacy, Paris Metro Pollution, Migrant Worker Struggles in Singapore
Data Journalism Top 10: Bats and the Next Pandemic, China’s Electric Battery Dominance, and Brazil’s Healthcare ‘Holes’

This work is licensed under a Creative Commons Attribution-NoDerivatives 4.0 International License
Republish our articles for free, online or in print, under a Creative Commons license.
Republish this article
This work is licensed under a Creative Commons Attribution-NoDerivatives 4.0 International License
Read Next
Africa Focus Data Journalism
How Data Journalism Is Changing the Face of Africa
Data journalism in Africa has made a powerful impact, from holding leaders accountable to refuting myths around domestic violence. But the field faces formidable challenges.
Case Studies Data Journalism GIJC23
Data-Driven Journalism: Roundup of Recent Standout Stories
The best of modern data journalism tells powerful stories that test assumptions. At GIJC23, two experts discussed strong recent investigations and what makes them stand out.
Data Journalism Data Journalism Top 10
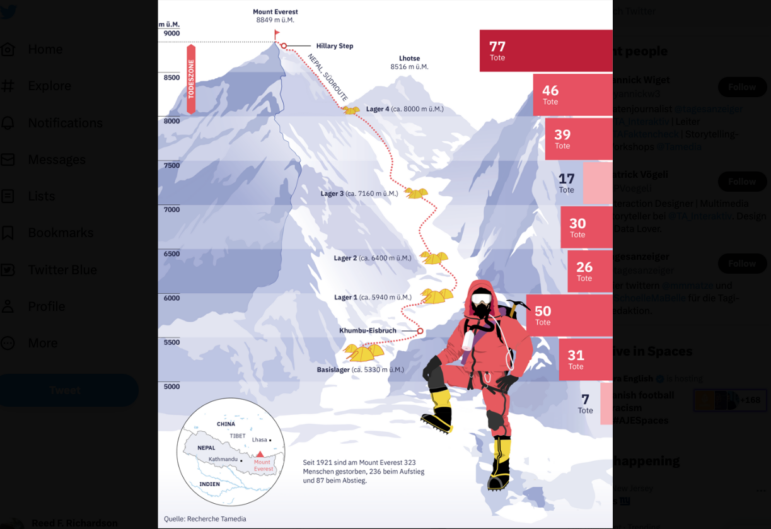
Data Journalism Top 10: Everest’s Deadly Legacy, Paris Metro Pollution, Migrant Worker Struggles in Singapore
This week, GIJN’s Top 10 in Data Journalism examines why the world’s tallest mountain has become increasingly deadly for those trying to climb it, pollution in Paris metro stations, US laws expanding gun access one year after the Uvalde mass shooting, and migrant worker struggles in Singapore.
Data Journalism Data Journalism Top 10
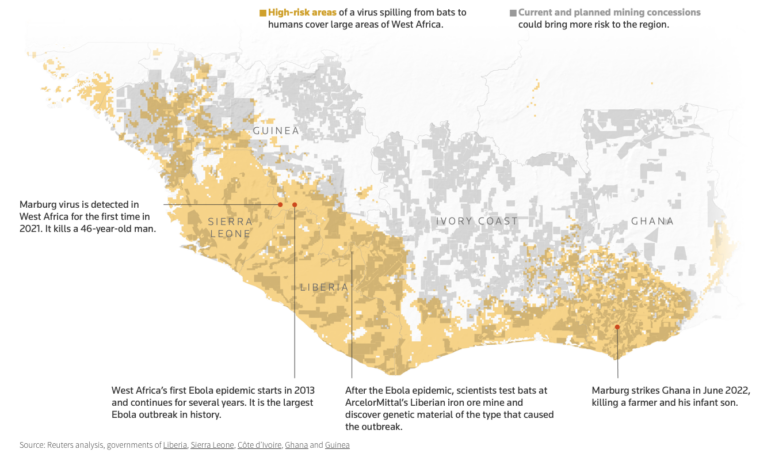
Data Journalism Top 10: Bats and the Next Pandemic, China’s Electric Battery Dominance, and Brazil’s Healthcare ‘Holes’
GIJN’s weekly, curated look at the Top 10 in Data Journalism highlights bats and predicting the location of the next pandemic, China’s electric battery dominance, and mapping out Brazil’s healthcare “holes.”