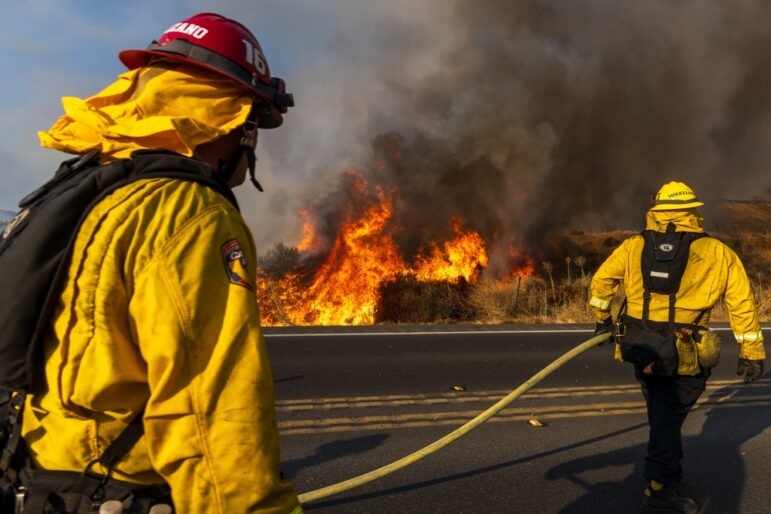
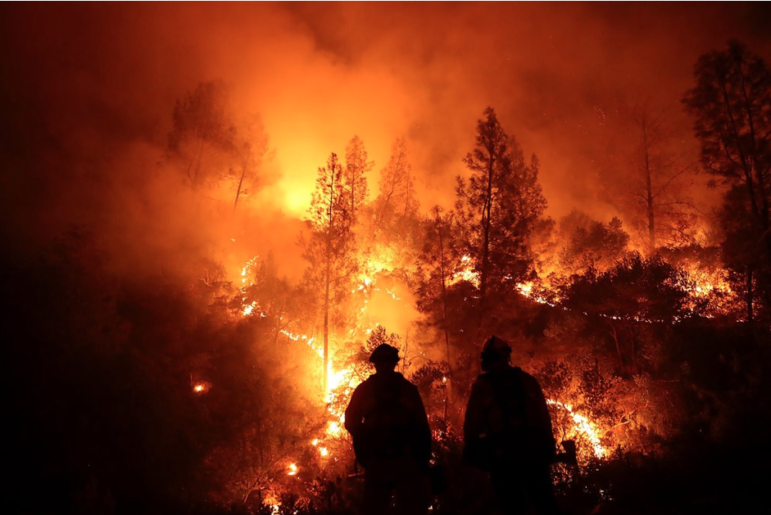
Firefighters trying to contain a wildfire in Riverside County in southern California, July 2023. Image: Shutterstock
How Collaboration Exposed Impacts of Wildfire Pollution-Reporting Rules
Read this article in
While many people have never heard of the “exceptional events rule” of the federal Clean Air Act, a 2023 investigation by The California Newsroom, MuckRock, and the Guardian found that more than 70 counties across 20 US states have used it to exclude pollution data from official US Environmental Protection Agency records.
This legal loophole — on the books since 2005 — allows air pollution to be erased from EPA statistics and regulatory decisions if the pollution was caused by “natural” or “uncontrollable” events, such as wildfires or volcanic eruptions.
These adjustments to the data can shift legal decisions made by the agency, enabling local regulators to claim the air was cleaner than it really was.
And what begins as a small change — to exclude a day of pollution here or there — can lead to decisions that help environmental agencies swerve away from tighter control on local polluters while muddling the picture of pollution’s true health risks.
Our investigation found that air regulators are turning to the exceptional events rule more often, in an attempt to meet air standards as they face wildfires escalating in frequency and severity. As the fires that blanketed much of the Midwest and Northeast US last summer showed, increasing smoke from wildfires can push pollution to unhealthy levels for weeks or even months.
But before our team of journalists started digging into the impact of this legal tool, even experts on the law were hard-pressed to say what agencies across the country used it the most and for which types of events.
It took a little over a year of dogged collaboration to unearth the data and documents to answer those questions, and then turn that information into a larger story about this detail of the law and its consequences. The end result was Smoke, Screened, a four-part investigative series.
In Collaborations, Two Plus Two Isn’t Always Four
We began our reporting for the series by asking ourselves a couple of questions: What can the US environmental agencies do about smoke pollution from wildfires? And who or what systems does that involve?
After exploring different threads of reporting for several weeks, the two of us had a conversation that sparked the rest of the investigation. We were mulling over what seemed to be a sentiment from experts that there isn’t much that government can do about pollution from wildfire smoke because wildfires are still understood as an exception, not the rule. One of us mentioned that there’s even a part of federal law called the “exceptional events rule” and right at that moment, the other remembered a column in EPA data called “events included.”
By the end of that conversation, we had realized that there could be a way to measure the impact of treating wildfires as exceptional, instead of the new normal in a climate-changed world.
We found ourselves having similar reporting revelations through the investigation. By deeply engaging with each team member’s specific skills and reporting strengths, the investigation found new avenues we couldn’t have imagined alone. Both of us began to feel like collaborating doesn’t just combine knowledge; sometimes it feels more like multiplying.
To foster this type of teamwork, the two of us kept a Google Document that we called our “daily messy,” where we each put daily reporting notes (see graphic below). We didn’t pressure ourselves to organize the journal much beyond a date and name for each of us, piling in notes from our to-do list, interviews, public records research, and data analysis.
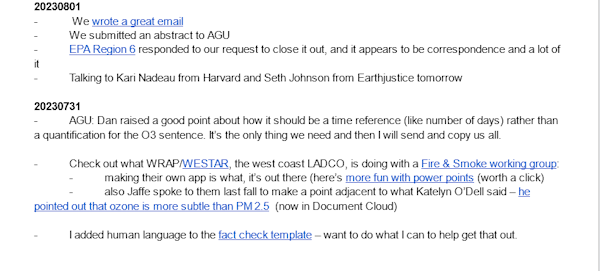
An example of two days of Peterson and Bergin’s daily notes. Image: Screenshot, SEJournal
Beyond our daily messy document, we kept all our work in a single Google Drive folder and forced ourselves to be as tidy as possible in file organization so that each of us could navigate each other’s work.
Our ethos was a version of “one man’s trash is another man’s treasure:” One reporter’s small, insignificant detail is the missing key to another reporter’s question.
This ethos was central for the two of us, but it extended to our larger team as well. At times, our team meetings included four tremendously talented editors from three different newsrooms, each with different areas of expertise. These editors examined our reporting, shaped the project’s scope, and helped us hone in on the stories we really wanted to tell.
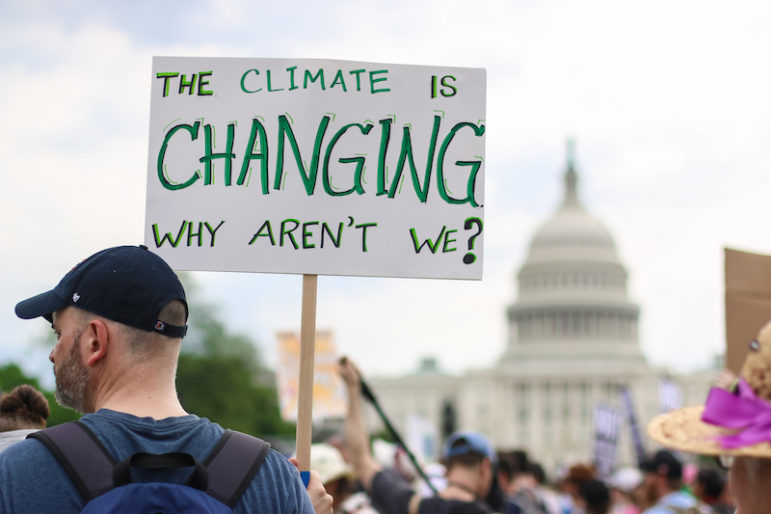
We worked with local reporters who helped ground our work with local sources, like Manola Secaira, who interviewed a thoughtful climate activist she had encountered in reporting for Capital Public Radio in Sacramento.
Another of these collaborators was California Newsroom data reporter Emily Zentner, who happened to live in an area of California that was pivotal to explaining the impact of exceptional events.
Zentner was also the creative force behind the investigation’s visual storytelling. She started this by talking through findings with Dillon Bergin and sketching out her ideas by hand. Bergin and Zentner then worked with Andrew Witherspoon and others on the Guardian graphics team to bring these sketches to life digitally (see images below).
Zentner was also the creative force behind the investigation’s visual storytelling. She started this by talking through findings with Dillon Bergin and sketching out her ideas by hand. Bergin and Zentner then worked with Andrew Witherspoon and others on the Guardian graphics team to bring these sketches to life digitally (see images below).
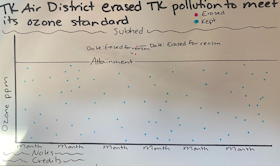
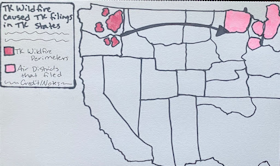
Above, Zentner’s original data visualization sketches. Images: Screeshots, SEJournal
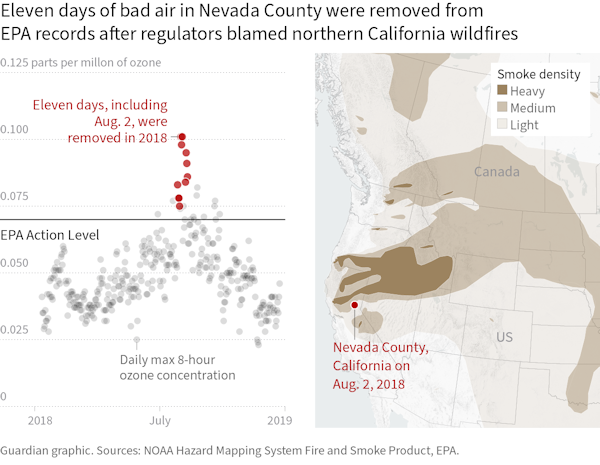
The final data visualization graphics for the Guardian based on those sketches. Images: Screenshots, the Guardian
FOIA and Follow Through
After interviewing a few EPA experts and a handful of other experts in the fields of atmospheric sciences and environmental law and policy, it became clear that we couldn’t easily get our hands on the information we wanted about exceptional events.
The documents submitted as exceptional events applications to the EPA weren’t held in one place, but instead at each EPA regional office. And data that described exceptional events in more detail wasn’t part of the EPA’s pre-generated data files that are available online.
The bulk of the information we needed would have to come through the Freedom of Information Act (FOIA) and open-records requests.
Our preliminary interviews and research helped us write the most specific FOIA language we could, but even with hours of research and interviews, our FOIA requests took on lives of their own.
First, we realized that several states contracted with third-party companies to do the analysis needed to submit applications to the EPA. So we decided to request all third-party contracts from every state, adding 50 more requests to the ones we were already managing.
We also noticed specific events and time periods that we wanted to hone in on, and filed requests to state agencies for email correspondence about those events to better understand what was happening on the ground.
After filing those, we ended up with over 90 FOIAs and state open-records requests — more than enough to make two reporters’ heads spin.
We stayed focused on following through in two ways: with public records officers to be sure we got the documents and with any new FOIAs based on the responses we received. We did this using MuckRock’s platform to share and organize requests, while sometimes exporting requests from MuckRock as CSVs to share and reference with each other.
At the same time, we developed a way to take notes and sort documents using DocumentCloud. Two other reporters, Holly J. McDede and Lindsay Shachnow, helped us review documents.
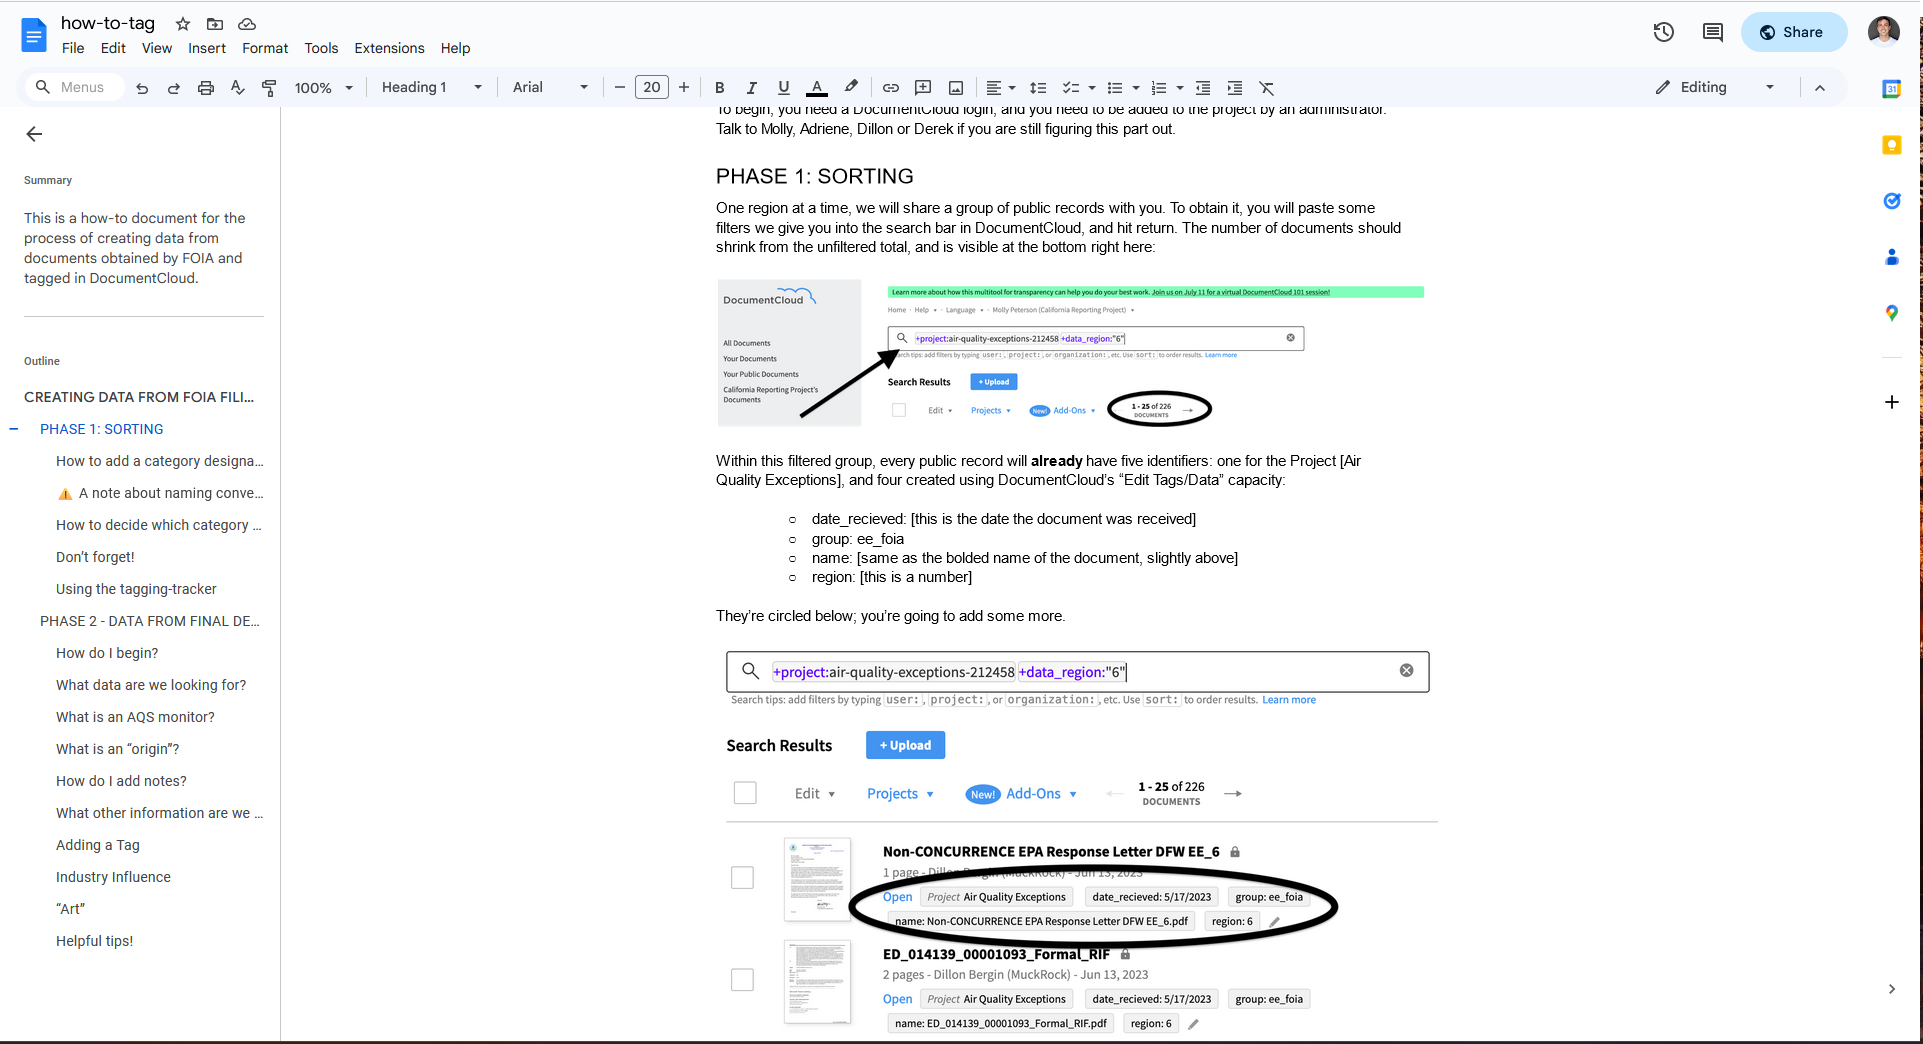
An internal memo on how to review documents so that the authors could enlist the help of other reporters and speed up the process. Image: Screenshot, SEJournal
In the end, the FOIAs we filed to follow up on our original batch of FOIAs became the basis for a critical part of the series — how business advocates have worked to promote the rule’s use.
Don’t Be Afraid to Tell the Story of the Far and the Near
Right after we filed our earliest FOIAs, we called back an expert that we had interviewed about exceptional events. She was skeptical about the EPA fulfilling our request.
But we did get the documents, and soon we were developing a better understanding of some aspects of exceptional events than our experts. This was both exciting and frightening. Breaking new ground meant that we wouldn’t be able to lean on other researchers’ expertise and methodology for each question we had.
Still, we kept going back to our core group of experts to gut-check our data and analysis with their expectations.
We also cross-checked the data by following it to where it was collected. To do this, we emailed state agencies asking them to confirm that they had submitted what we saw in the data.
Spot-checking individual data points and questioning state agencies about the data began to reveal stories we could hone in on as well. One of these developed into a collaboration with the Chicago Tribune, about how state agencies in the Midwest may band together to file an exceptional event application that could involve more states at once than any previous application.
In the end, we were able to tell the bigger-picture story because we had scrutinized the smaller ones. And on the flip side, we were able to tell smaller stories because we had laid the groundwork of the big one.
We do think there are even more local stories about the exceptional events rule to tell though, and we want you to find the ones that affect air quality in the community you report on.
In a recent SEJ webinar we demonstrated how to explore the data from our investigation in Datasette to kick-start reporting on exceptional events.
We also wrote a reporting guide tipsheet, a longer description of our methodology and a detailed README on GitHub where all the data for the investigation is published. And we published the 138 exceptional event demonstrations we received from regional EPA offices through FOIA requests on DocumentCloud.
Beyond these resources, if you have any questions about reporting on Clean Air Act exceptional events, don’t hesitate to reach out to either of the authors of this article.
This story was originally published by SEJournal and is reprinted here with permission.
 Dillon Bergin is MuckRock’s data reporter. He uses data and public records to power investigative reporting. Bergin was a member of the Documenting COVID-19 team, a project funded by MuckRock and the Brown Institute for Media Innovation. Before that, he was a Report for America corps member with Searchlight New Mexico and a Fulbright Germany Journalism Fellow. He can be reached at dillon@muckrock.com.
 Molly Peterson is a Los Angeles-based correspondent at Texas-headquartered Public Health Watch. She has investigated climate and health with an eye toward accountability for The California Newsroom, KQED, WWNO, and other public media outlets, lately focusing on urban heat and worker safety, sea level rise, flooding, and wildfires. A lawyer in California, she still never thought she would get to file this many public records requests. She can be reached at mpeterson@publichealthwatch.org.
Climate Crisis: Ideas for Investigative Journalists

Getting Data – Using Open Records Laws
Resources for Finding and Using Satellite Images
Investigating Mpox: An Explainer and Resource Tipsheet
How Journalistic Teamwork Uncovered Years of Regulatory Failure in Texas
8 Ways Journalists Visualized California’s Out-of-Control Wildfires
Reporting on Climate Injustice in One of the Hottest Towns in America
Tips for Better FOIA Requests: Taking Right-to-Information Access to the Next Level

This work is licensed under a Creative Commons Attribution-NoDerivatives 4.0 International License
Republish our articles for free, online or in print, under a Creative Commons license.
Republish this article
This work is licensed under a Creative Commons Attribution-NoDerivatives 4.0 International License
Read Next
Case Studies
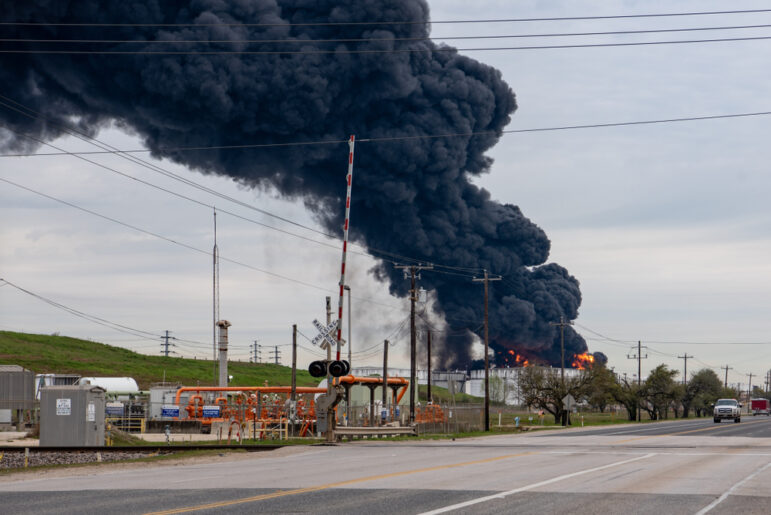
How Journalistic Teamwork Uncovered Years of Regulatory Failure in Texas
The authors give a behind-the-scenes look at their investigation into a massive chemical fire in Houston in March 2019.
Reporting Tools & Tips
8 Ways Journalists Visualized California’s Out-of-Control Wildfires
California officials and firefighters are becoming increasingly concerned that the drier, windier conditions spurred on by the warming climate will make wildfires more devastating and their seasons longer. But are enough people paying attention to their root causes and dire consequences? Here are eight ways US journalists have been chronicling this year’s wildfires.
News & Analysis Reporting Tools & Tips
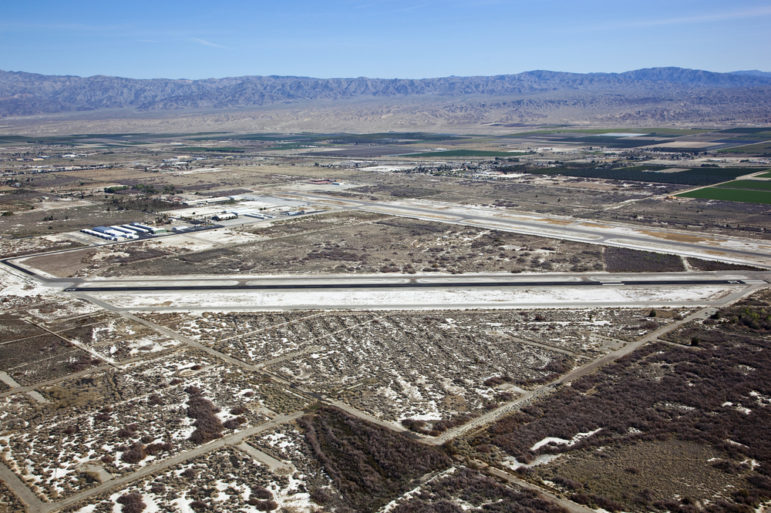
Reporting on Climate Injustice in One of the Hottest Towns in America
Climate reporter Liz Weil and visual reporter Mauricio Rodríguez Pons first became interested in Thermal, which is just north of California’s Salton Sea, because it is one of the hottest places in America. They soon realized it’s also a prime example of how wealth inequality is inextricably linked to climate justice.
GIJC23 Reporting Tools & Tips
Tips for Better FOIA Requests: Taking Right-to-Information Access to the Next Level
Many reporters rely on FOIA requests and RTI legislation for their investigations. But how do you take these requests to the next level?