Data Journalism
GIJN’s Data Journalism Top 10: Visualizing Climate Change, Numbers from Phrases, Democratic Donors, Moscow Money
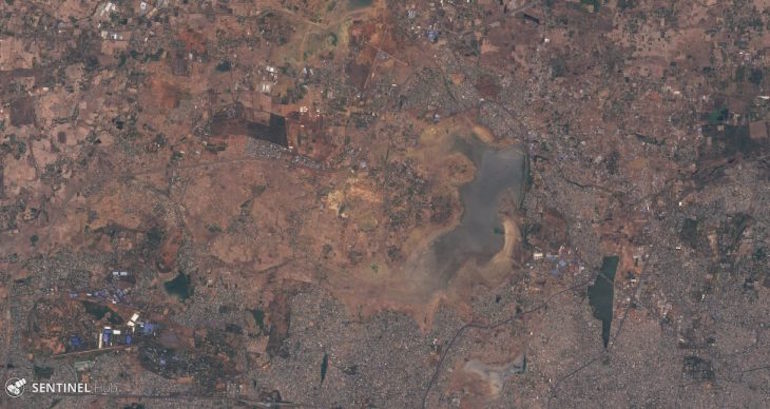
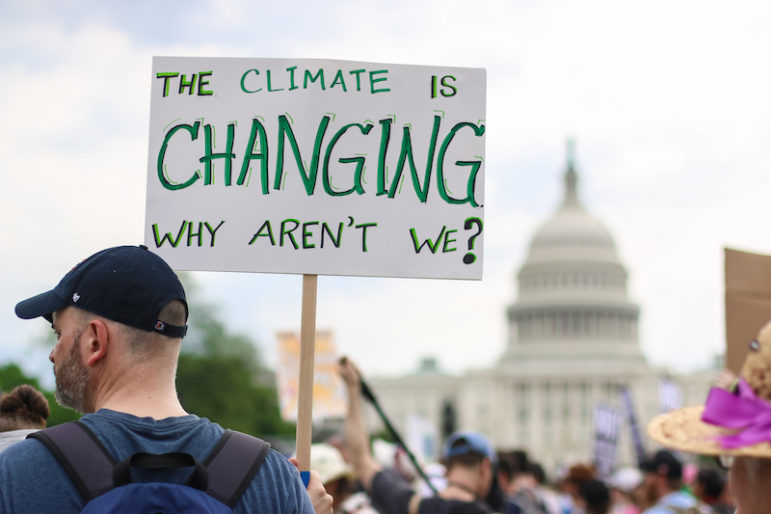
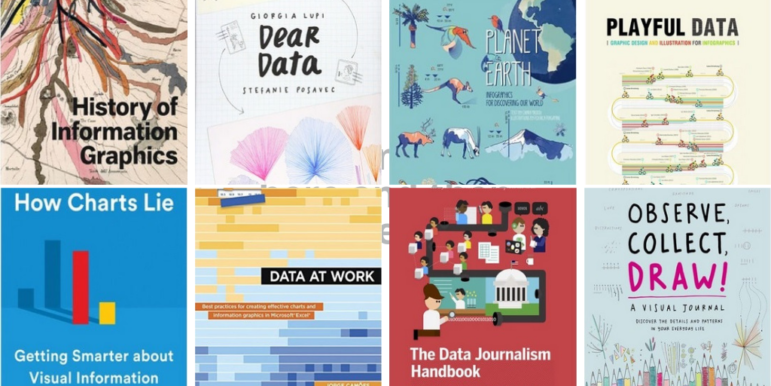
What’s the global data journalism community tweeting about this week? Our NodeXL #ddj mapping from July 29 to August 4 finds a number of articles related to the climate crisis, including the BBC’s piece on tree planting and its interactive tool on temperatures across the world, as well as Alberto Cairo’s blog post on misleading charts created by climate deniers. We also found useful tips and tools: a data GIF maker by Google News Initiative, Datajournalism.com’s strategies for teaching data journalism, and Paul Bradshaw’s tutorial on how to extract numeric data from phrases.