Data Journalism Top 10: Disinformation Ad Revenue, Bolsonaro’s Bubble, Russian Mobilization Marriages, Itaewon Tragedy
Read this article in

Step-By-Step Guide for Journalists on the Basics of Google Sheets

Tipsheet for Using Ocean Data in Your Investigations

No Coding Required: A Step-by-Step Guide to Scraping Websites With Data Miner

GIJC23 – The Future of Data Journalism: New Analytical Tools, Data Visualization, and AI
A wealth of information is revealed by analyzing digital advertisements: ProPublica found that disinformation sites are earning revenue from automated Google ads, and The Washington Post discovered vastly different political messaging originating from Republican and Democratic candidates for the US midterm elections. Our weekly NodeXL and human curation of the most popular data journalism stories on Twitter also features an analysis of pro-Bolsonaro tweets, an estimate of Russian mobilization numbers by looking at marriage rates, and a timeline of the Itaewon crowd crush tragedy.
Ads Fueling Disinformation
Google has previously declared that it works to combat misinformation, but an investigation by ProPublica finds that the automated digital advertisement arm of the multinational technology company funnels ad revenue to sites that peddle disinformation in Europe, Latin America, and Africa. According to the nonprofit’s analysis of more than 13,000 articles on thousands of websites and an interview with a former Google leader, it also reported that the tech giant was weak in enforcing its own policy for non-English sites, which bans placing ad content on sites that make unreliable or harmful claims. Find the methodology of the investigation here.
Analyzing Political Ads
The Washington Post is busy analyzing advertisements ahead of the US midterm elections. By looking at television and digital ad spending data from AdImpact, journalists were able to determine the patterns of campaign messaging on both sides of the political spectrum. Democrats are spending more money on ads focused on criticizing the character of their opponents and issues such as abortion rights, while Republicans are paying for ads focused on crime, taxation, and inflation.
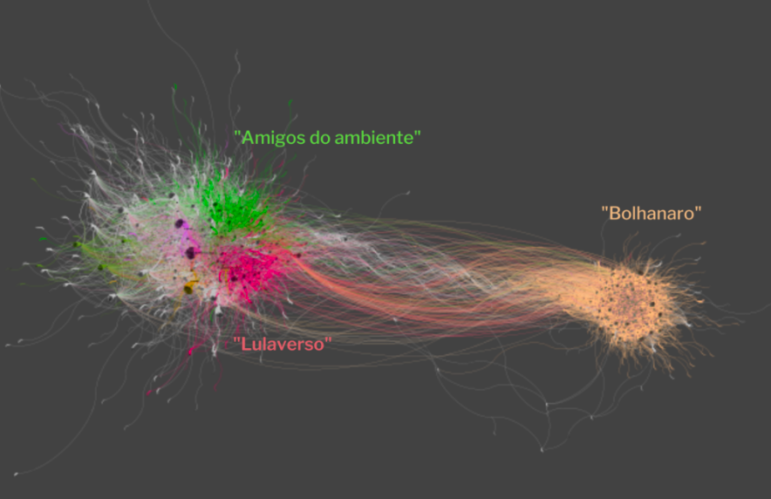
Bolsonaro Bubble
The recent presidential election in Brazil saw incumbent Jair Bolsonaro lose to Luiz Inácio Lula da Silva, popularly known as Lula, who was president from 2003 to 2010. Based on an analysis of 954,700 tweets that reference the words Amazon, deforestation, mining, and burning, InfoAmazonia and PlenaMata were able to visualize the discourse and dynamic of accounts that are pro-Bolsonaro, pro-Lula, and pro-environment. From the analysis, journalists found that 97% of the interactions made by pro-Bolsonaro accounts occurred within their own bubble.
Russian Mobilization Marriages
Russia’s partial war mobilization, announced in September, has sparked a boom in weddings across the country. Russian independent media outlet Mediazona reports that this is likely due to authorities relaxing marriage requirements for newly enlisted soldiers. Instead of having to apply one month in advance, men can now register their union on the spot. By calculating “excess marriages” — the increase in marriages over the historical average — journalists estimated that the number of people drafted into the army by mid-October could be as high as 492,000. Read the original piece in Russian and an abridged version in English.
Documents on Russian Occupation
The Russian army had occupied Balakliia, a quiet town in northeast Ukraine, since March. The troops, however, beat a hasty retreat in September, leaving behind thousands of documents in a rundown vehicle repair complex that served as a base during their occupation of the town. Reuters journalists combed through these documents, which included a floral notebook belonging to an unnamed staff officer that shed insights on the coordinates of other Russian intelligence units, battles waged, soldiers killed, and the loss of military equipment.
Germany’s Groundwater Atlas
Falling groundwater levels can lead to sinking lands. German nonprofit newsroom CORRECTIV analyzed data from around 6,700 measuring points over three decades to find out where groundwater has depleted, risen, or remained the same. It then investigated the causes for these trends. Readers can search for groundwater levels in their region using the interactive search form in the story.
Water Contamination in Spain
According to an analysis of more than 13 million records of water sampling results in Spain, there have been 4,115 instances in 411 municipalities between 2016 and 2021 in which the tap water was not fit for human consumption. The analysis, carried out by DATADISTA together with Greenpeace España, indicated that the water had been contaminated by nitrates, likely from organic and inorganic fertilizer. Here’s a tweet thread of DATADISTA’s investigations into Spain’s water supply.
Neighborhood Livability in Berlin
Using data from the Environmental Justice Atlas, German daily Der Tagesspiegel created an interactive map that highlights the green space, noise levels, air pollution, and heat stress for residential areas in Berlin. Journalists found an unfair distribution of healthy living spaces — socially disadvantaged neighborhoods are more often the ones with a higher risk for heat, noise, and air pollution.
World Cup: All You Need to Know
This year’s World Cup will be held in Qatar from November 20 to December 18. Are you a fan of the tournament? Off the top of your head, do you know which country has lifted the coveted trophy the most times? Or which stadium has seen the most number of goals scored? Using World Cup information from 1930 to 2018, The Times of London’s data journalist George Willoughby analyzed every World Cup match to date and presented the data in an interactive piece.
Itaewon Crowd Crush Tragedy
On October 29, a festive Halloween celebration of nearly 100,000 people in Seoul’s nightlife district of Itaewon turned into tragedy. At least 155 people died in a crowd crush along a narrow, 40 meter-long alley that measured between 3.2 and 4 meters wide. The Straits Times detailed how the calamity unfolded using a scrollytelling timeline, and visualized and explained the factors that could lead to a crowd surge disaster.
Thanks again to Marc Smith and Harald Meier of Connected Action for gathering the links and graphing them. The Top Ten #ddj list is curated weekly.
 Eunice Au is GIJN’s global team manager. Previously, she was a Malaysia correspondent for Singapore’s The Straits Times, and a journalist at Malaysia’s New Straits Times. She has also written for The Sun, Malaysian Today, and Madam Chair.
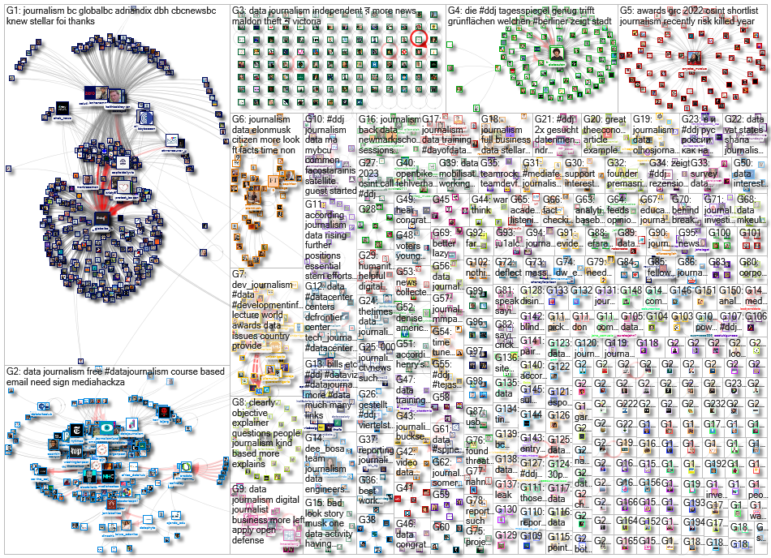
For a look at NodeXL’s mapping on #ddj and data journalism on Twitter, check out this map.
Step-By-Step Guide for Journalists on the Basics of Google Sheets
Tipsheet for Using Ocean Data in Your Investigations
No Coding Required: A Step-by-Step Guide to Scraping Websites With Data Miner
GIJC23 – The Future of Data Journalism: New Analytical Tools, Data Visualization, and AI

One Name at a Time: How Die Zeit Built a Searchable Database of Nazi Party Members
Visualizing a Trillion Dollars, India’s Warming Cities, Russian Mercenaries at Sea, and World Cup Player Physiques

Rare Earth Rivalry, Falling Birth Rates, Violence in the Sahel, and 70 Years of Eurovision Lyrics

How the Hindu Is Embedding AI Into Its Data Journalism

This work is licensed under a Creative Commons Attribution-NoDerivatives 4.0 International License
Republish our articles for free, online or in print, under a Creative Commons license.
Republish this article
This work is licensed under a Creative Commons Attribution-NoDerivatives 4.0 International License
Read Next
Data Journalism
One Name at a Time: How Die Zeit Built a Searchable Database of Nazi Party Members
An online tool set up by the German newspaper Die Zeit, in cooperation with archives in Germany and in the United States, allows people to search several million Nazi Party membership cards.
Data Journalism Top 10
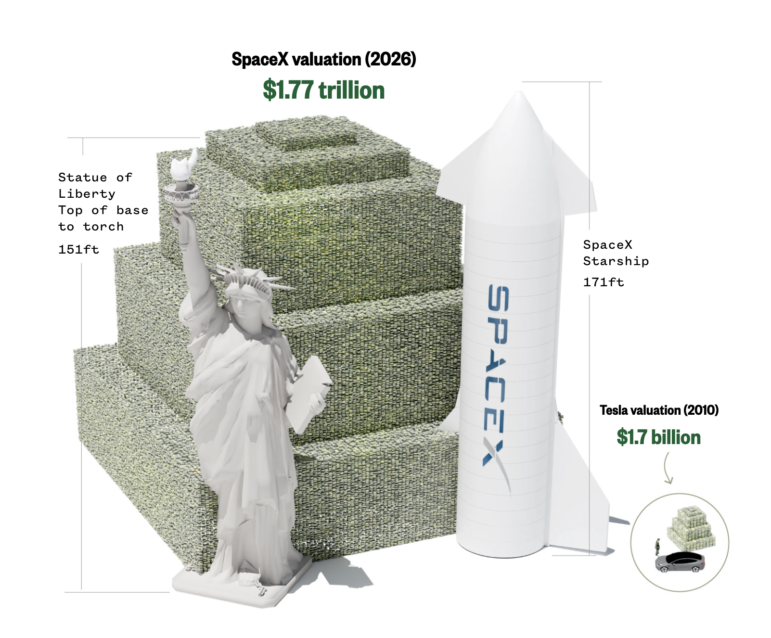
Visualizing a Trillion Dollars, India’s Warming Cities, Russian Mercenaries at Sea, and World Cup Player Physiques
Also highlighting how films portray Ukrainians, increasing tree cover in Spain, and how couples meet.
Data Journalism Top 10
Rare Earth Rivalry, Falling Birth Rates, Violence in the Sahel, and 70 Years of Eurovision Lyrics
Also highlighting China’s squid fishing fleet off Argentina, how redistricting is shaping America’s midterms, and why 2.1 billion people still lack safe drinking water.
Data Journalism
How the Hindu Is Embedding AI Into Its Data Journalism
LLMs are quietly reshaping data journalism workflows at The Hindu, helping reporters process vast document sets, write scripts and build interactive tools.