
How the Hindu Is Embedding AI Into Its Data Journalism
Read this article in


In recent months, journalists at The Hindu parsed nearly 22 million voter records across three Indian states, built an election results interface without writing a line of code manually, and assembled low-cost heat sensors to measure how different workers experience extreme temperatures.
Much of that work, Srinivasan Ramani says, was accelerated by large language models (LLMs), used not to generate prose, but to process documents, write code, and structure investigations.
Ramani, deputy national editor and senior associate editor at The Hindu, outlined this approach at our AI in Media Forum Bangalore 2026.
His focus was not on automation of writing, but on how low-code and AI-assisted development are reshaping data journalism workflows inside a legacy newsroom.
“AI,” he said, “is a very sophisticated intern. You tell it exactly what to do. It does it. But you remain in control.”
Parsing 22 Million Voter Records
One of the most extensive projects Ramani described examined India’s Special Intensive Revision (SIR), a periodic update of voter rolls conducted by the Election Commission. In the latest round, authorities released records listing deleted voters and the reasons cited.
The data was not analysis-ready. It came in the form of image-based PDFs, effectively photographs of forms, in Hindi.
In Bihar alone, the team processed around 90,000 files covering 65 lakh (6.5 million) records. Tamil Nadu involved roughly 78,000 files and 97 lakh (9.7 million) records; West Bengal, about 80,000 files and 58 lakh (5.8 million) records. In total, the three states accounted for roughly 22 million (2.2 crore) records.
The newsroom used optical character recognition (OCR) to convert image-based files into machine-readable text, translated them into English and stored the results in databases. Ramani relied on LLMs to generate SQL queries through natural-language prompts rather than writing database commands manually.
The analysis surfaced patterns that prompted further reporting. For example, in Bihar, more women than men appeared to have been deleted from voter rolls despite higher male out-migration. And in several polling booths, large shares of deleted voters were marked as deceased even though many were under 50.
Scrutiny widened after the Supreme Court of India directed the Election Commission to release full deletion records. The Hindu built a searchable database of deleted names and reasons and published separate state-level investigations.
“These were not conclusions drawn by AI,” Ramani said. “The hypothesis was ours. The political and social context was ours. AI helped us process the scale.”
The findings were discussed in Parliament and in court proceedings, and in Bihar some corrections to voter rolls followed public scrutiny and ground reporting.
Building Election Interactives, Without Writing Code
AI use extended beyond document processing. For India’s 2019 and 2024 general elections — national parliamentary polls — the team built interactive maps allowing users to filter results by region, state, rural-urban classification and urban clusters.
The application used JavaScript, HTML and D3, but Ramani did not manually write the code. “I did not write a single line myself,” he noted. “The entire application was built over two weeks using prompts in ChatGPT, Gemini, and Claude.”
The team collected publicly available election data, broke the interface into components — filters, maps, list views — and used models to generate annotated code for each, enabling verification.
India’s general elections involve nearly a billion eligible voters. Building tools that allow constituency-level filtering at that scale is technically demanding, particularly under deadline.
Previously, such projects required in-house engineers or outside volunteers. AI-assisted development shortened that loop. “Deadlines are sacrosanct in journalism,” he said. “Now we don’t have to extend them because we’re waiting for technical help.”
Measuring Heat at Street Level
Not all projects were digital. In Chennai, where summer temperatures are extreme, the team examined how heat stress varies across working-class occupations.
Using AI-assisted guidance, the newsroom assembled low-cost Arduino-based devices to record temperature and humidity every 10 seconds. Components were sourced locally, and the total project cost was ₹15,000-₹20,000 (about $180-$240).
Four devices were given to a cook, a fisherman, an industrial worker, and an autorickshaw driver, who recorded data during a 24-hour period, Ramani explained.
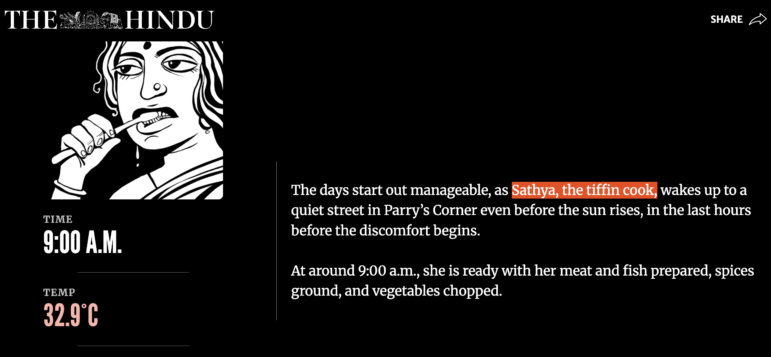
Image: Screenshot, The Hindu
The heat index, a measure combining temperature and humidity, varied sharply, peaking at 69°C (156.2 F) in one case. The results were plotted over time to show disparities in exposure.
After publication, the Tamil Nadu government announced a heat management plan and explored using similar devices for further study.
Ramani described the project as an example of combining hardware experimentation with data storytelling, with AI assisting in design and troubleshooting.
AI in the Workflow, Humans in Control
Ramani emphasized that AI tools fit into an established data journalism pipeline: hypothesis formation, data collection (via scraping, public records requests or mining structured sources), cleaning and structuring, analysis, visualization, and publication.
He categorized his team’s work into five types: simple trend analysis; correlation studies; factor analysis; causal investigations; and deep-dive accountability reporting.
AI now assists at multiple stages: generating web-scraping scripts, processing unstructured documents, suggesting database queries and building front-end interfaces.
But human oversight, he said, remains central.
In one instance, an AI-generated script processed documents sequentially, slowing the analysis. Only after a technologist suggested multi-threading, or parallel processing, did the model produce a more efficient version when prompted accordingly.
“You need human insight to tell it what to optimize,” Ramani said.
He cautioned against using AI to draw editorial conclusions. In structured tasks — extracting data, generating code — hallucination risks are lower, he argued, because outputs can be tested directly.
From Graphics to Investigations
Ramani traced the evolution of data journalism at The Hindu over the past decade, from visual add-ons to traditional reporting to a dedicated function with data journalists, designers and editorial coders building applications and investigations.
Among its major projects was an excess deaths analysis during the COVID-19 pandemic. Using civil registration data, the newsroom estimated that official COVID death counts were underreported by a factor of five to six.
The finding was contested at the time, but later analyses by the World Health Organization and subsequent official data revisions pointed to substantial undercounting.
“Today, data-driven reporting is integrated across print and digital operations rather than siloed as a specialist unit. Many of these investigations are published as premium stories,” Ramani said, adding that the newsroom has seen higher subscriptions and engagement for such work.
“We want a more informed audience. This kind of work helps us move in that direction. Across projects, AI does not replace journalistic judgement. It expands the scale at which it can operate,” he said.
Thís article was originally published by the World Association of News Publishers (WAN-IFRA) and is reprinted here with permission.
 Neha Gupta is WAN-IFRA’s research editor, where she analyses journalism trends and reports about business and technical developments in journalism.
This work is licensed under a Creative Commons Attribution-NoDerivatives 4.0 International License
Republish our articles for free, online or in print, under a Creative Commons license.
Republish this article
This work is licensed under a Creative Commons Attribution-NoDerivatives 4.0 International License
Read Next

Data Journalism
Developing a Data State Of Mind: Key Tips for Editors
Data is woven into how journalists cover everything from local government spending to global climate change patterns, but for editors without a specialist background, it can be daunting.

Data Journalism My Favorite Tools
My Favorite Tools: Indian Journalist and Data Designer Gurman Bhatia
For GIJN’s My Favourite Tools series, we spoke with Indian journalist and information designer Gurman Bhatia. She has worked at the Hindustan Times in Delhi and been a part of the award-winning team at Reuters Graphics, where she worked on visualizations for topics as diverse as election fraud in India, use of force during protests in Hong Kong, and bushfires in Australia.
10 Questions
What I’ve Learned: Lessons and Advice from The Caravan’s Vinod K. Jose
For the inaugural post in our new interview series about investigative reporters operating in tough press freedom environments around the world, GIJN speaks to Vinod K. Jose, executive editor of India’s premier long-form journalism magazine, The Caravan. He tells us about the challenges of leading an intrepid team in the face of rising autocracy in the world’s largest democracy.

Data Journalism
How a WhatsApp Community Is Bringing India’s Data Storytellers Together
Recently, more than 400 people gathered in the Indian city of Bengaluru for VizChitra 2026, a conference on data visualization and storytelling — but that is only a small part of the story.