
Image: Screenshot, puntofisso.net
Rare Earth Rivalry, Falling Birth Rates, Violence in the Sahel, and 70 Years of Eurovision Lyrics
Rare earth elements are essential for modern technology — and China’s dominance of rare earth supply chains gives it leverage over the global economy. Bloomberg investigated China’s hold on the industry, drilling into the geology, chemistry, and funding that fuels the sector, and concluded that the US will need at least another decade to catch up.
Our roundup of the Top 10 in Data Journalism, looking at stories from May 7 to May 20, also includes a Reuters investigation into China’s squid fishing fleet off Argentina using vessel-tracking data, The Washington Post’s dive into how Polymarket users lose money at the same rate as online gamblers, and El CLIP’s investigation into lethal and non-lethal US drug trafficking enforcement.
US and China’s Rare Earth Rivalry
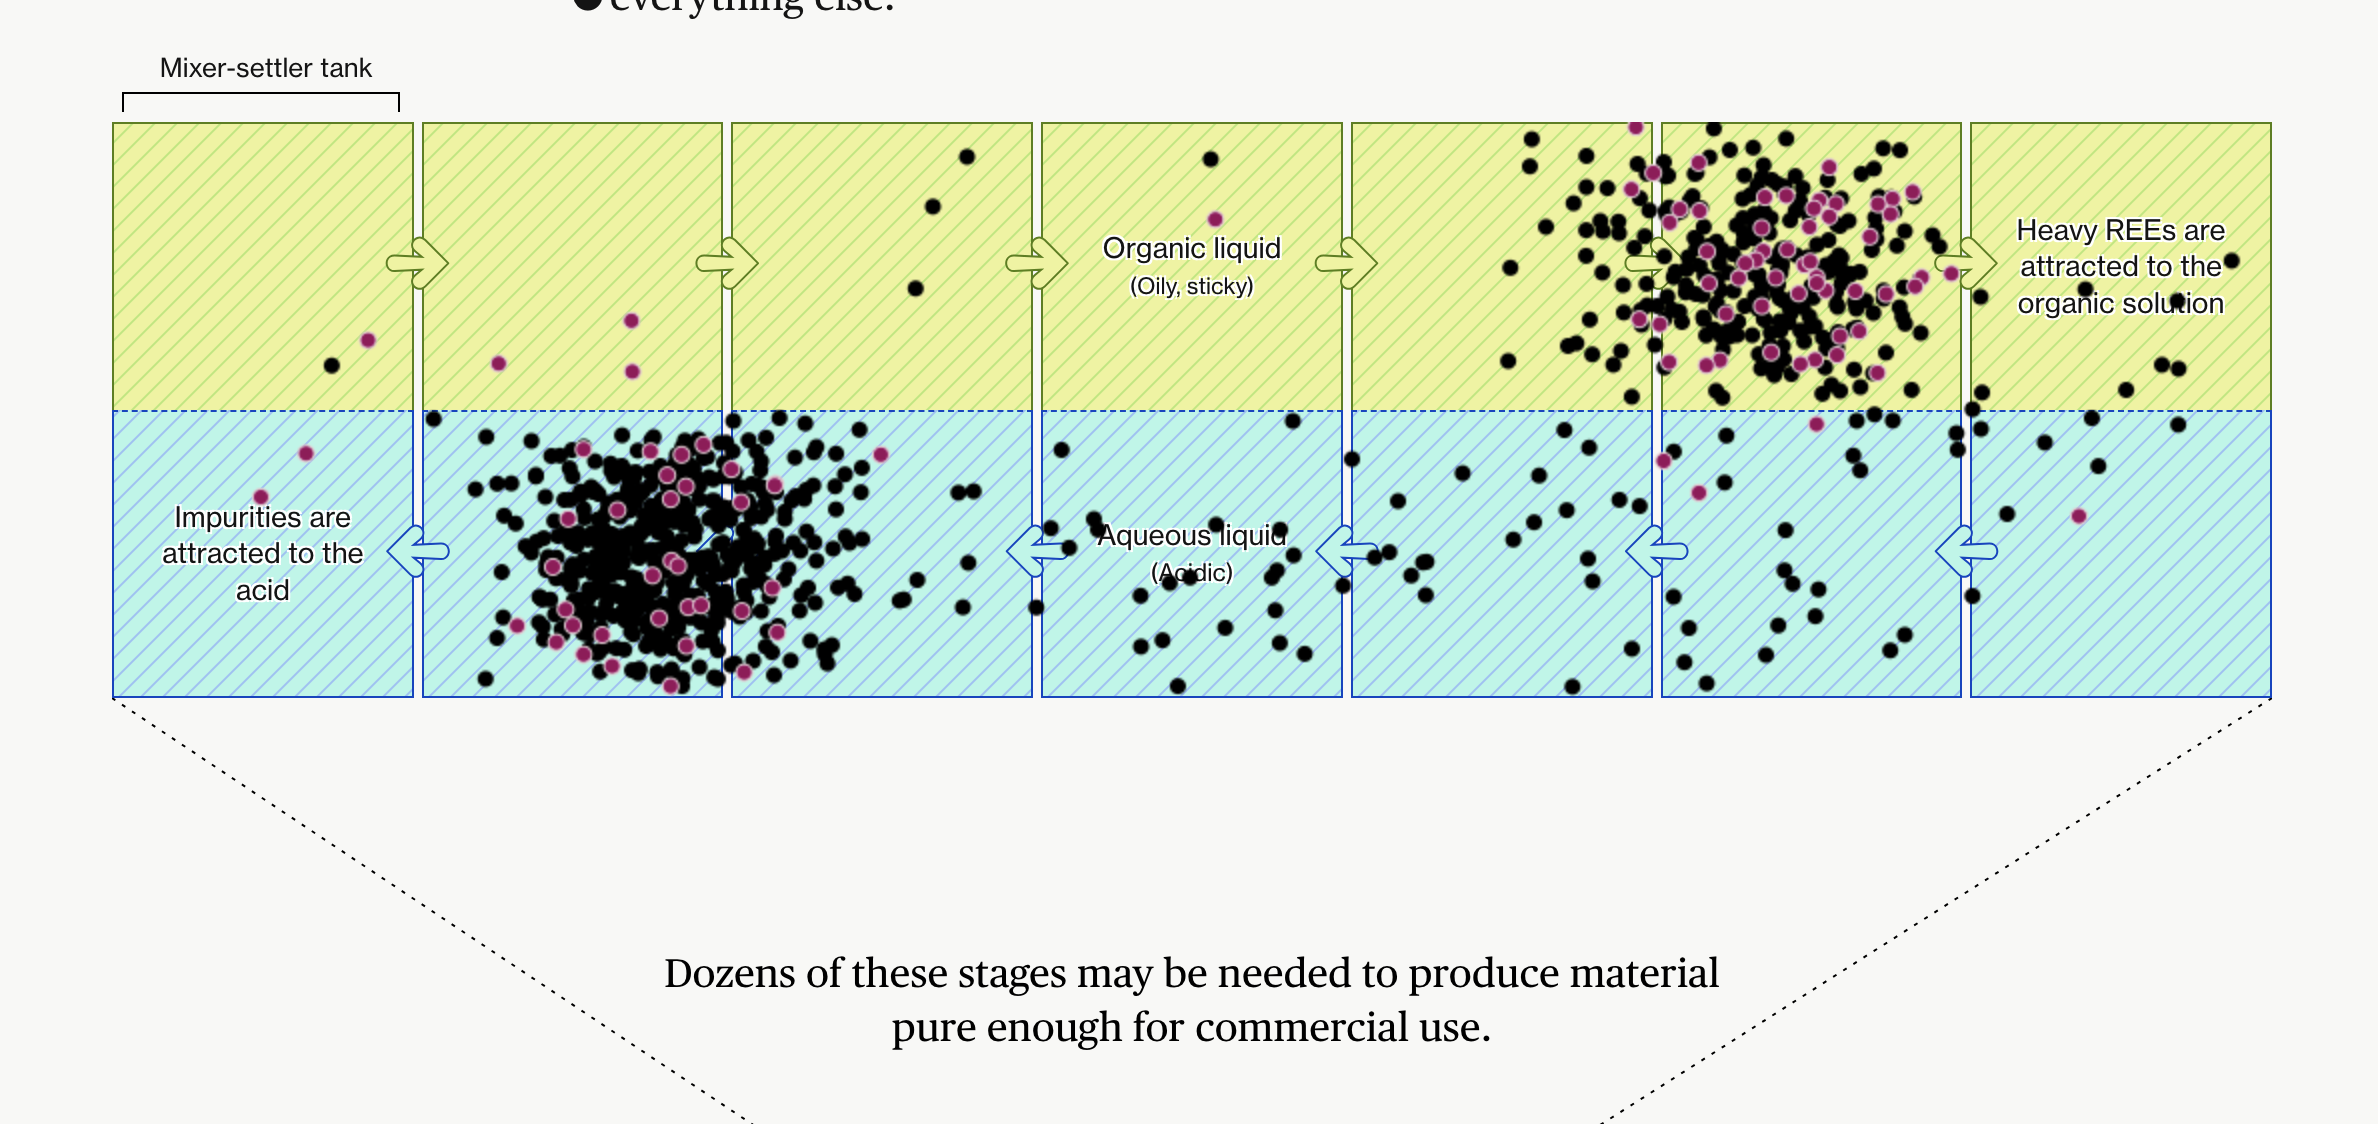
Image: Screenshot, Bloomberg
China’s grip on rare earth supply chains — an industry which has long tested US-China relations — is not expected to loosen until the next decade, according to projections from mining consultancies. Bloomberg investigated why China dominates the industry, moving through the geology, chemistry, and funding that have been fed into the sector. Using proportional area charts, the story visualizes annual mining and refining capacity outside of China. It also draws attention to rarer and critical heavy rare earths, dysprosium and terbium, used in electric vehicles and fighter jets. Step-by-step diagrams illustrate why the separation process — isolating individual rare earth elements — is hard to replicate, walking through the hundreds of mixer-settler tank stages required to isolate elements, in a process that China has spent decades perfecting with thousands of trained specialists, against fewer than 100 in the US.
China’s Squid Fleet Off Argentina
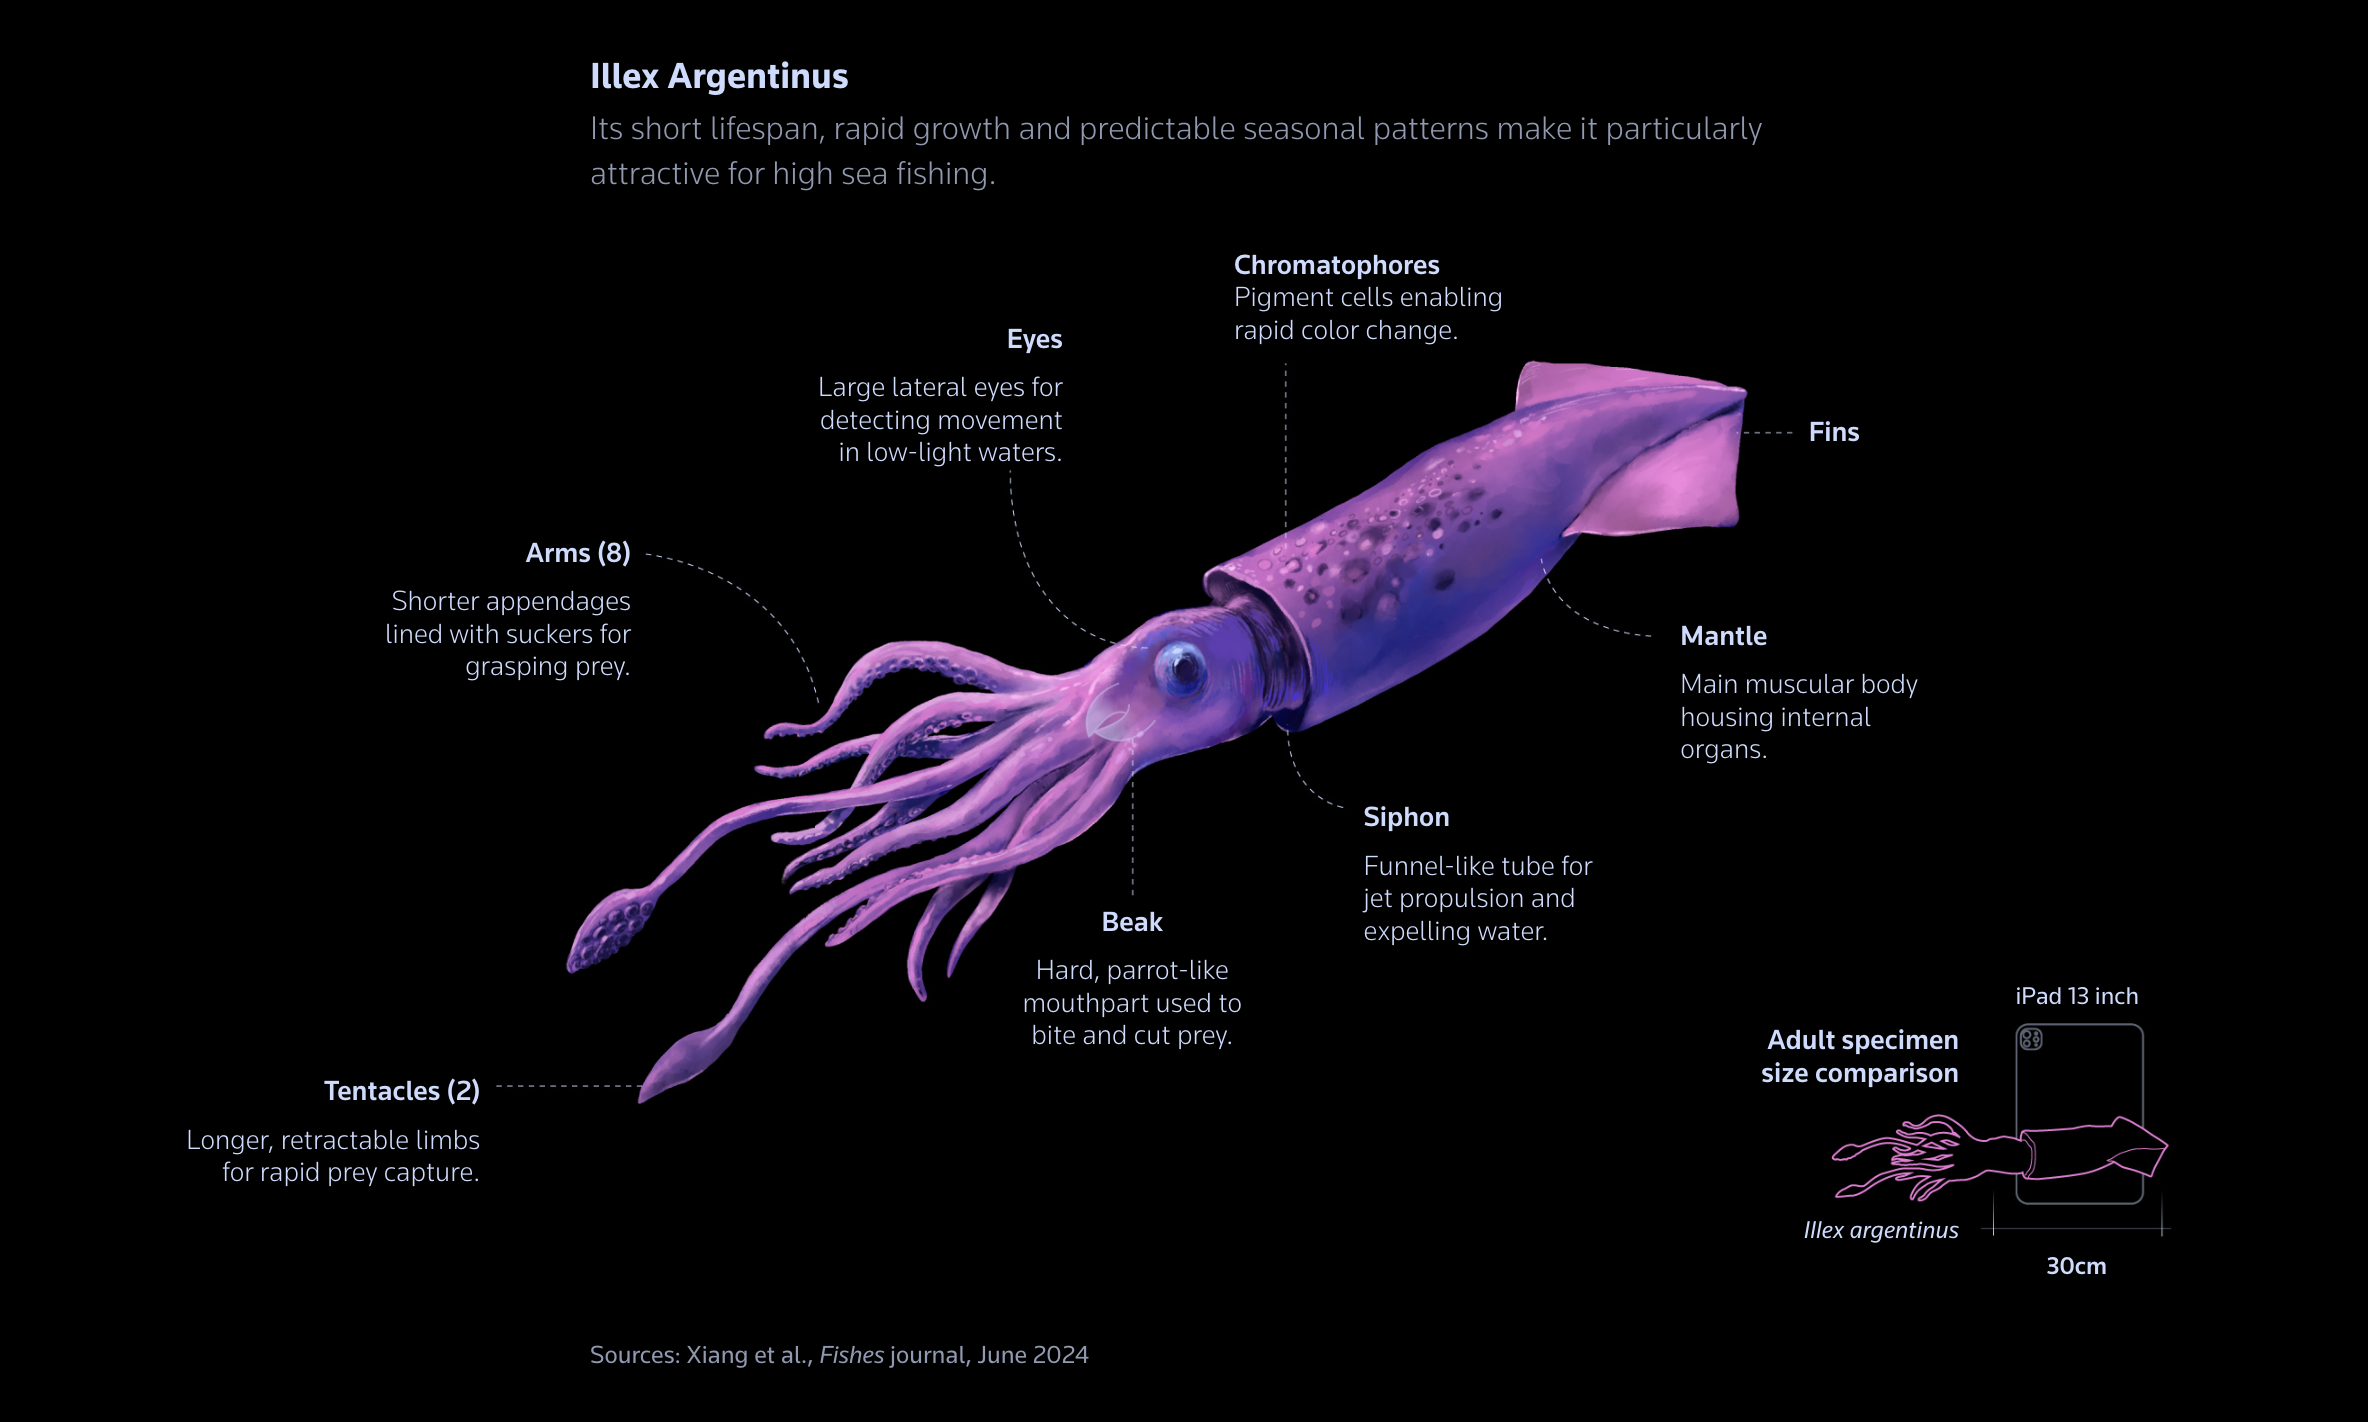
Image: Screenshot, Reuters
Hundreds of Chinese fishing vessels gather just beyond Argentina’s Exclusive Economic Zone each year, hunting Illex squid. The activity has raised suspicions among Argentine and US officials that some boats carry surveillance antennae and conduct continental shelf mapping inconsistent with fishing — claims which have not been proven. Through on-board reporting, interviews with US and Argentine officials, and using vessel-tracking data from Starboard Maritime Intelligence, Reuters tracked how China’s fishing fleet dwarfs rival ones near Argentina and used NASA Black Marble night satellite data and illustrations to explain the mechanics of squid jigging, a technique used to catch Illex squid involving brightly colored ‘jigs’ to attract squid at night.
Redrawing Districts as Midterms Loom
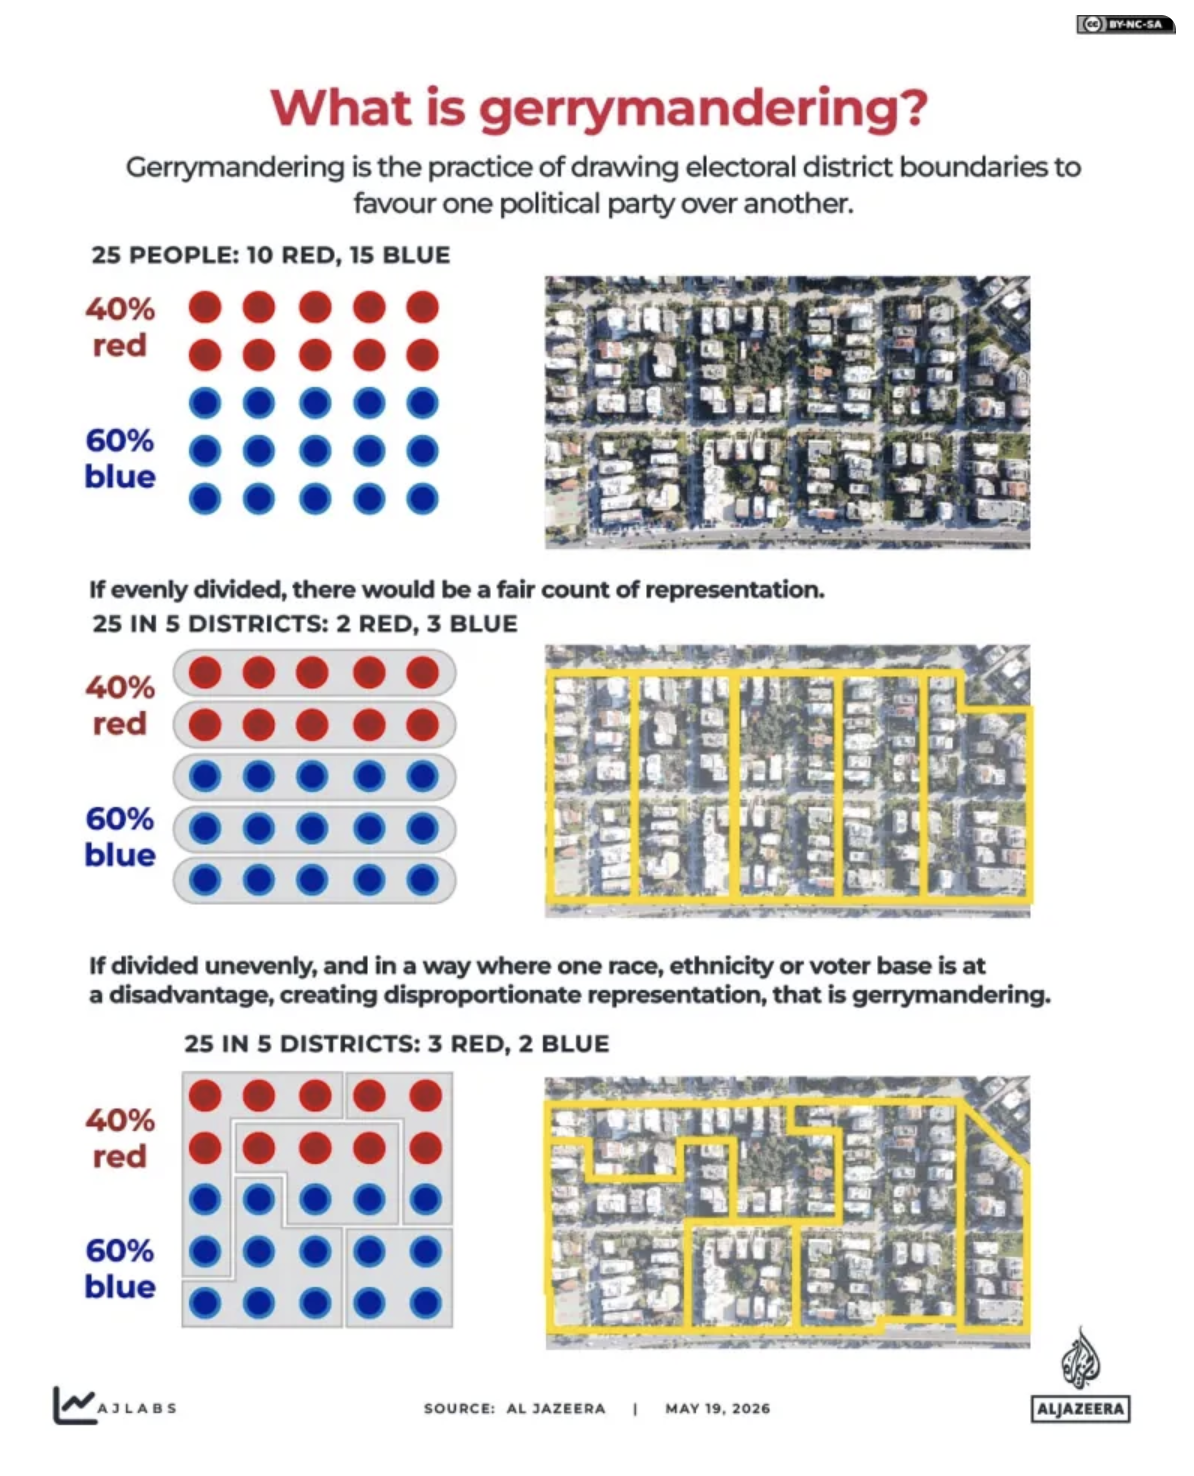
Image: Screenshot, Al Jazeera
With America’s midterm elections less than six months away, both Republicans and Democrats are fighting not just for votes but over the maps where those votes will count. Al Jazeera’s visual explainer dissects how the midterms and primaries work, what redistricting is, and how the shape of a district boundary can determine the outcome of a race before a single vote is cast. Republicans currently hold the House of Representatives by 220 to 215, making every redrawn line existential for both parties. The story visualized the stakes using before-and-after district maps across six states, showing how Republican-controlled legislatures in some states have pushed competitive seats into safe ones. An infographic explains the two core gerrymandering techniques, packing and cracking, while an embedded interactive game lets readers draw their own districts to experience firsthand how identical voter blocks can be carved into different outcomes.
Violence in the Sahel
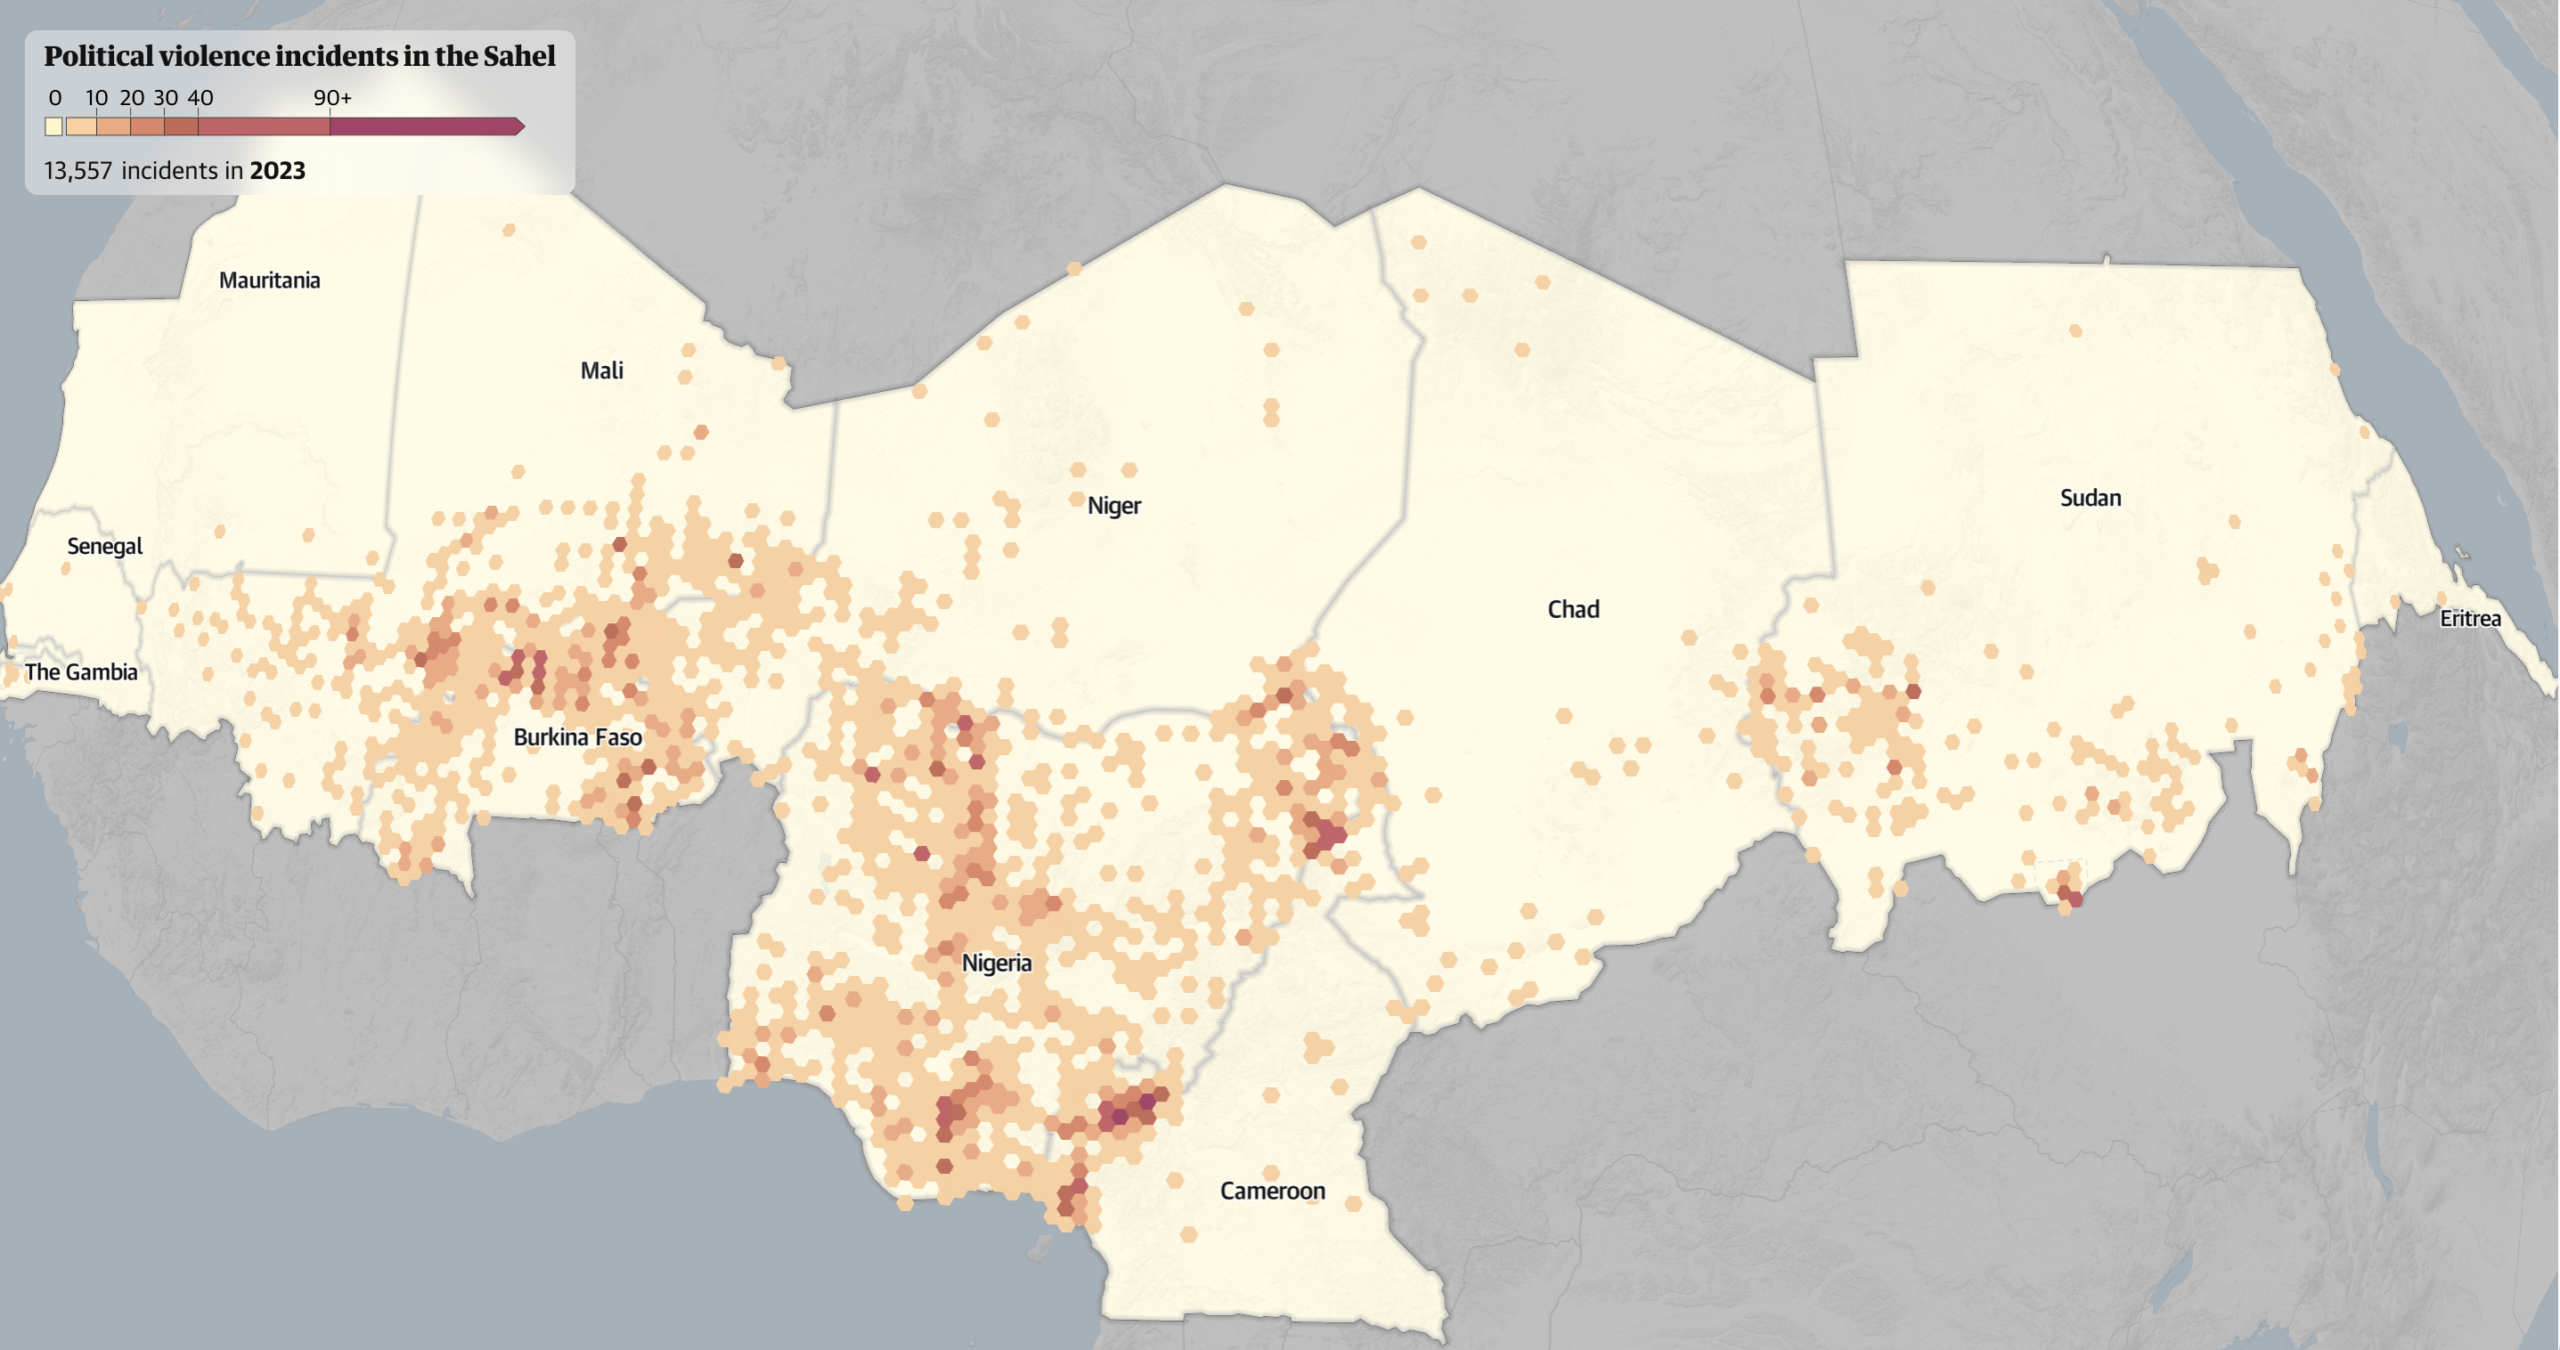
Image: Screenshot, The Guardian
Terrorism-related deaths have been surging in the Sahel, the vast region stretching across the African continent south of the Sahara, with political violence rising, particularly in Nigeria. The Guardian drew on data from the armed-conflict monitor service ACLED and the Global Terrorism Index 2026 to map both the scale and geographic spread of violence. A stacked area chart shows the Sahel accounting for roughly half of all global terrorism deaths for three consecutive years, up from under 1% in 2007. Maps recording instances of violence, scaled by fatality, count Nigeria’s crises, including deaths caused by bandit militias in the northwest, Fulani-farmer conflicts across six western states, newly emergent jihadist attacks in some areas, and the long-running Boko Haram insurgency in the northeast. Experts point to structural governance failure as the root cause.
Is Digital Media Affecting Birth Rates?
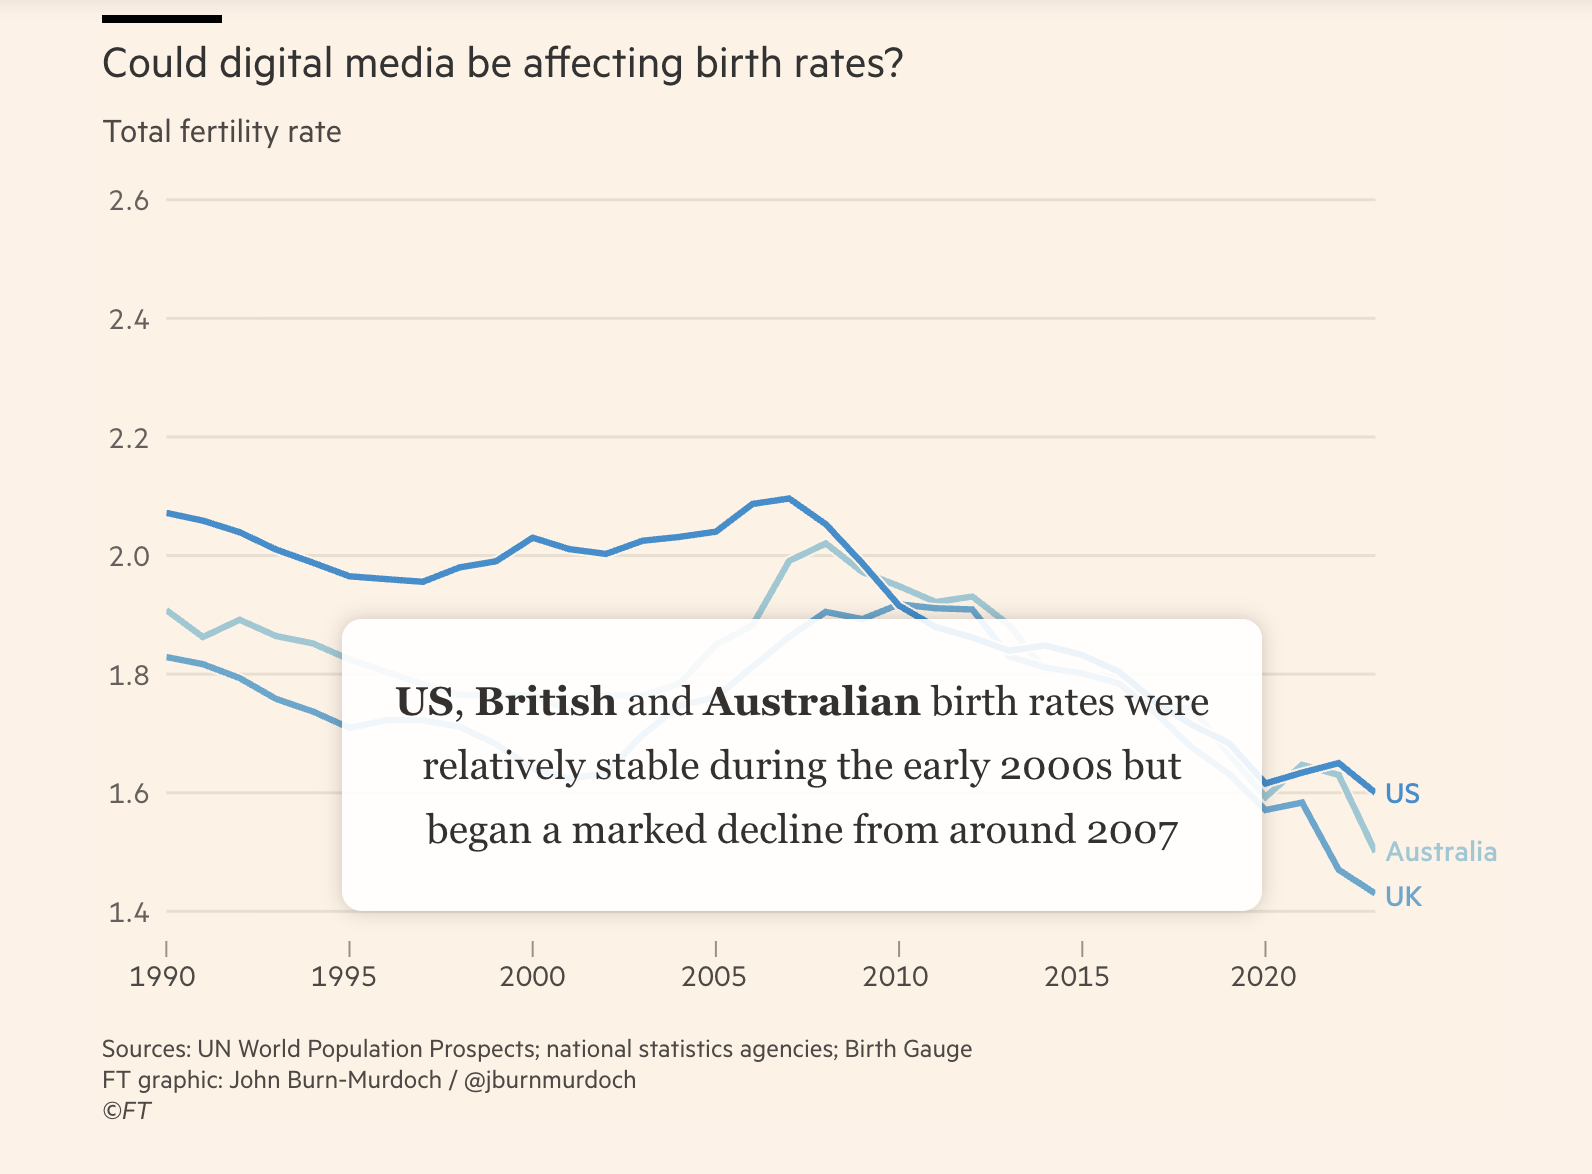
Image: Screenshot, Financial Times
The pace and breadth of the decline in birth rates in many parts of the world is defying estimates. The average number of children born to each woman has now fallen below the replacement rate — which keeps populations stable — of 2.1 in more than two thirds of the world’s 195 countries. Financial Times chief data reporter John Burn-Murdoch analyzed data including population records, statistics agencies, Google searches, and Birth Gauge (which tracks global fertility decline) to examine the main causes. In the past, he notes, birth rates declined because couples started having fewer children. Today, the main reason is that there are fewer couples. A comprehensive set of charts and graphs examines various factors impacting birth rates in a range of countries, such as earnings, education, relationship rates, and housing costs. While in many countries the decline in births and coupling is steeper among those with the lowest incomes and least education — contrary to the stereotypes of women putting careers before children — economic factors don’t fully explain the global trend. A new University of Cincinnati paper that examined the effect of 4G mobile networks on birth rates in the US and UK found that the number of births fell first and fastest in areas that received high-speed cell phone connectivity earlier — its authors suggesting that the decline of in-person socializing among young people in the smartphone era is impacting fertility rates.
Investigating US Drug Trafficking Enforcement
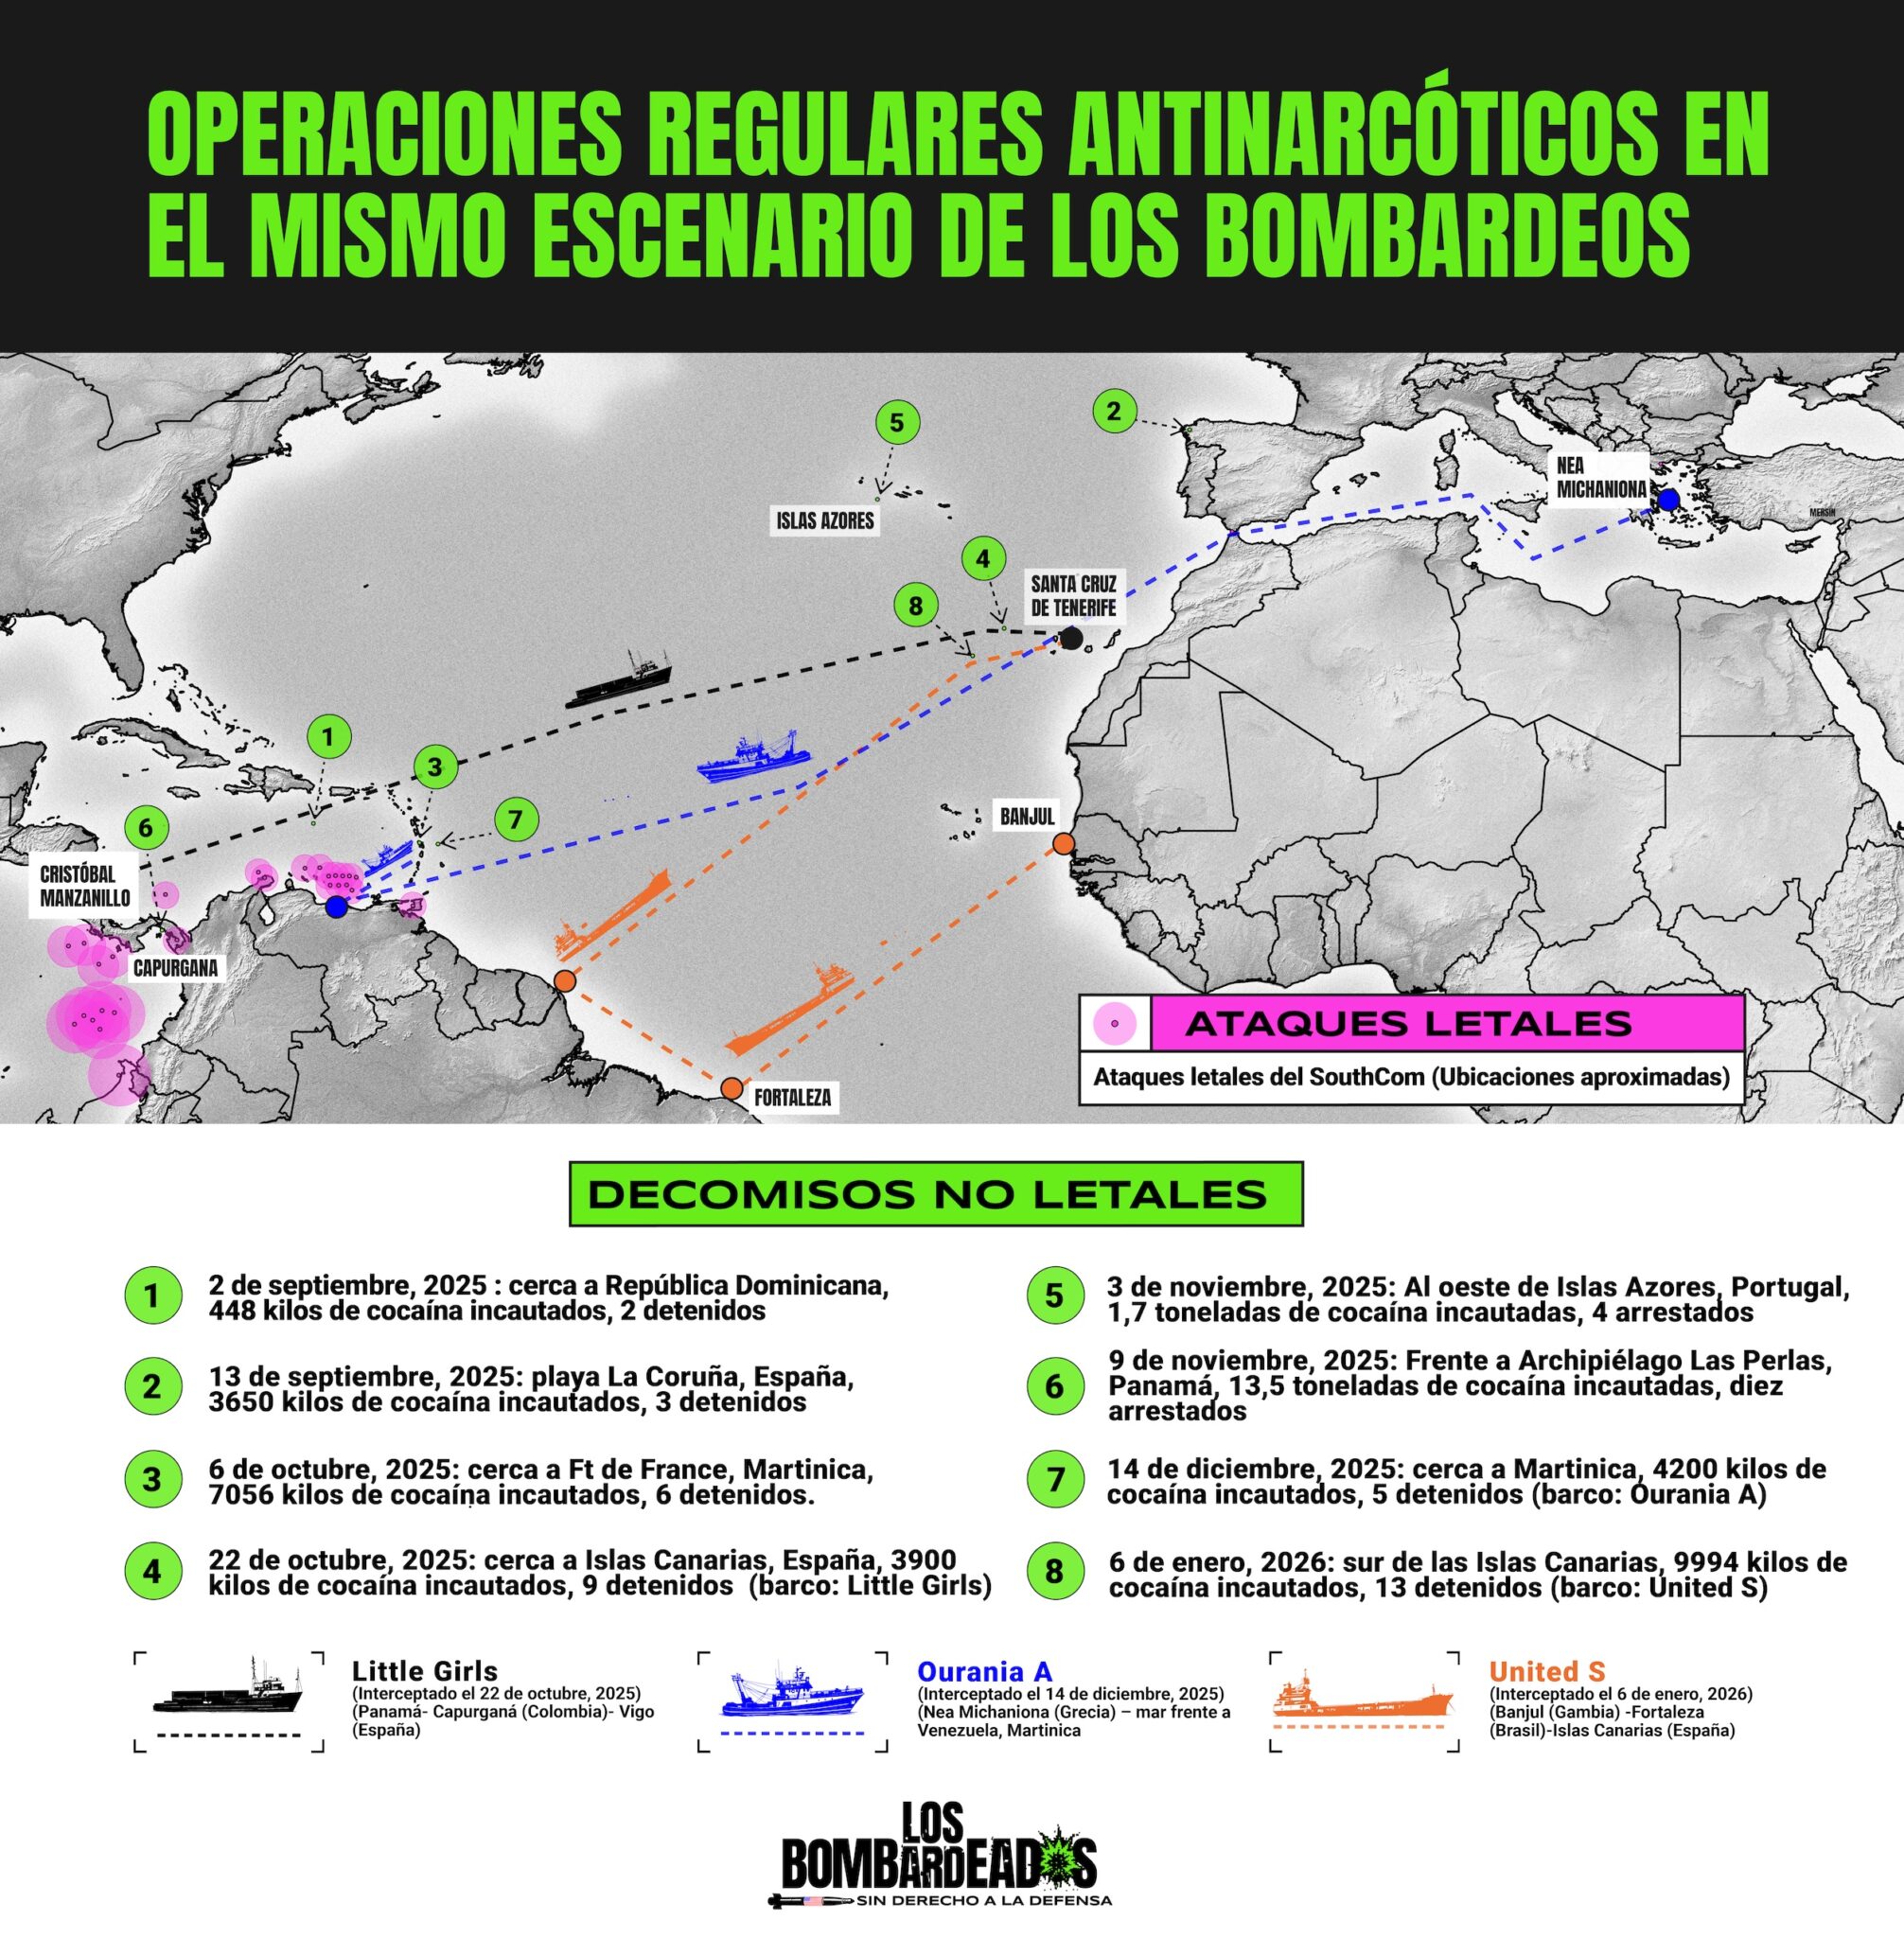
Image: Screenshot, Latin American Center for Investigative Journalism (El CLIP)
Between September 2025 and February 2026, the US Drug Enforcement Agency (DEA) and the multiagency Joint Interagency Task Force-South coordinated two notably different responses to drug trafficking in Atlantic, Pacific, and Caribbean waters. El CLIP drew on official police statements, MAOC-N press releases, US Coast Guard records, and vessel-tracking data from Global Fishing Watch to show differences in styles of intervention: lethal and non-lethal. The US agencies, coordinating with intelligence forces, coast guards, and the navies of up to 15 countries, seized 140 tons of cocaine and captured 160 crew members without firing a single shot — while during the same period and through the same intelligence chain of command, US forces guided strikes on 44 vessels, killing at least 141 people and recovering no drugs. The story highlights three cases of intercepted vessels that ran concurrently with the US Operation Southern Spear bombings in the same Caribbean corridor, sometimes days and miles apart. AIS trajectory maps trace each vessel’s route across the Atlantic, pinpointing where the bombing campaign’s victims died alongside the passage of ships the system chose to follow rather than destroy. The findings suggest that cargo volume, not threat level, determined whether crew members faced an interdiction or being bombed — with the latter being employed more often against smaller vessels.
Safe Drinking Water Remains Out of Reach
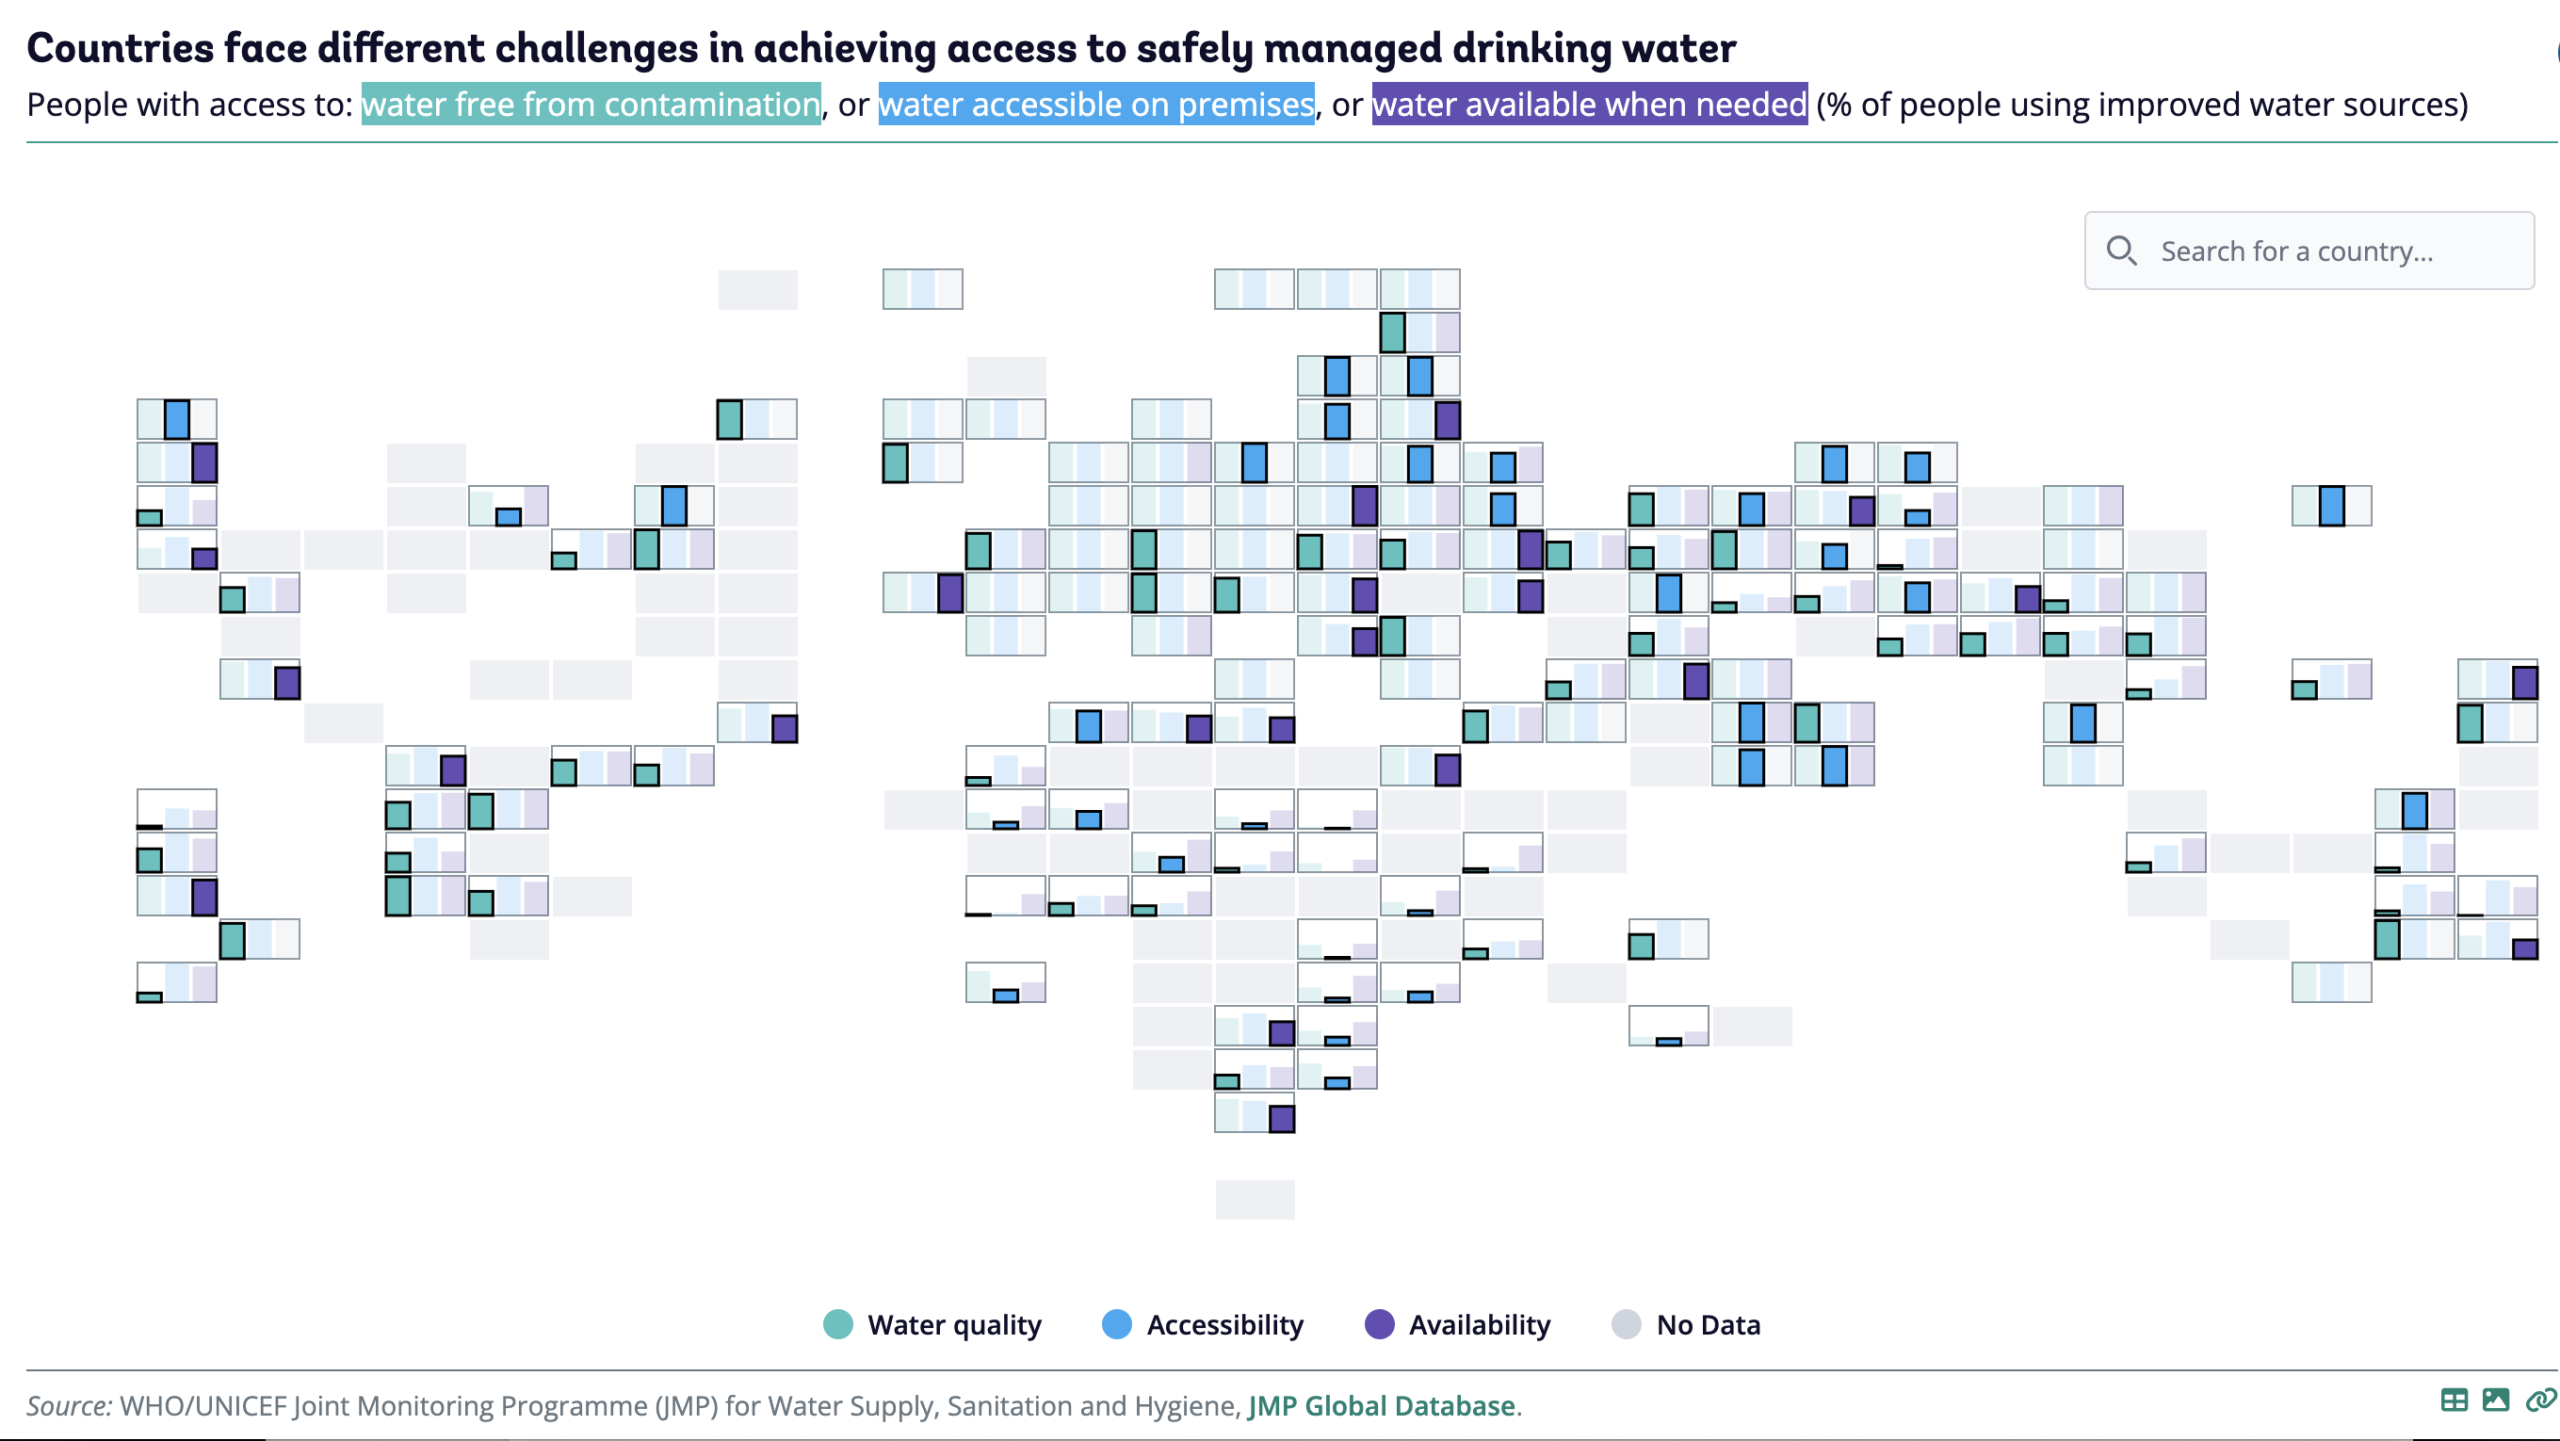
Image: Screenshot, World Bank
Access to safe drinking water has improved globally over two decades, but 2.1 billion people – around a quarter of the world’s population – still lack access to water that is clean, safe, and available at home. As part of the Atlas of Global Development 2026, the World Bank analyzed WHO and UNICEF Joint Monitoring Programme data, finding that in 48 of 94 countries with available data, water quality is the most common limiting factor holding back safe water access. A stacked bar chart tracks the five levels of drinking water service globally from 2000 to 2024, while also comparing urban and rural breakdowns across regions. A tile grid map also compares which countries have access to water free from contamination, accessible water on premises, and water available when needed. The piece then focused on contamination with E. coli, which can lead to acute diseases and pose life-threatening risks, finding that in 26 countries more than half the population drinks water with a high or very high contamination risk.
Exported Data Centers
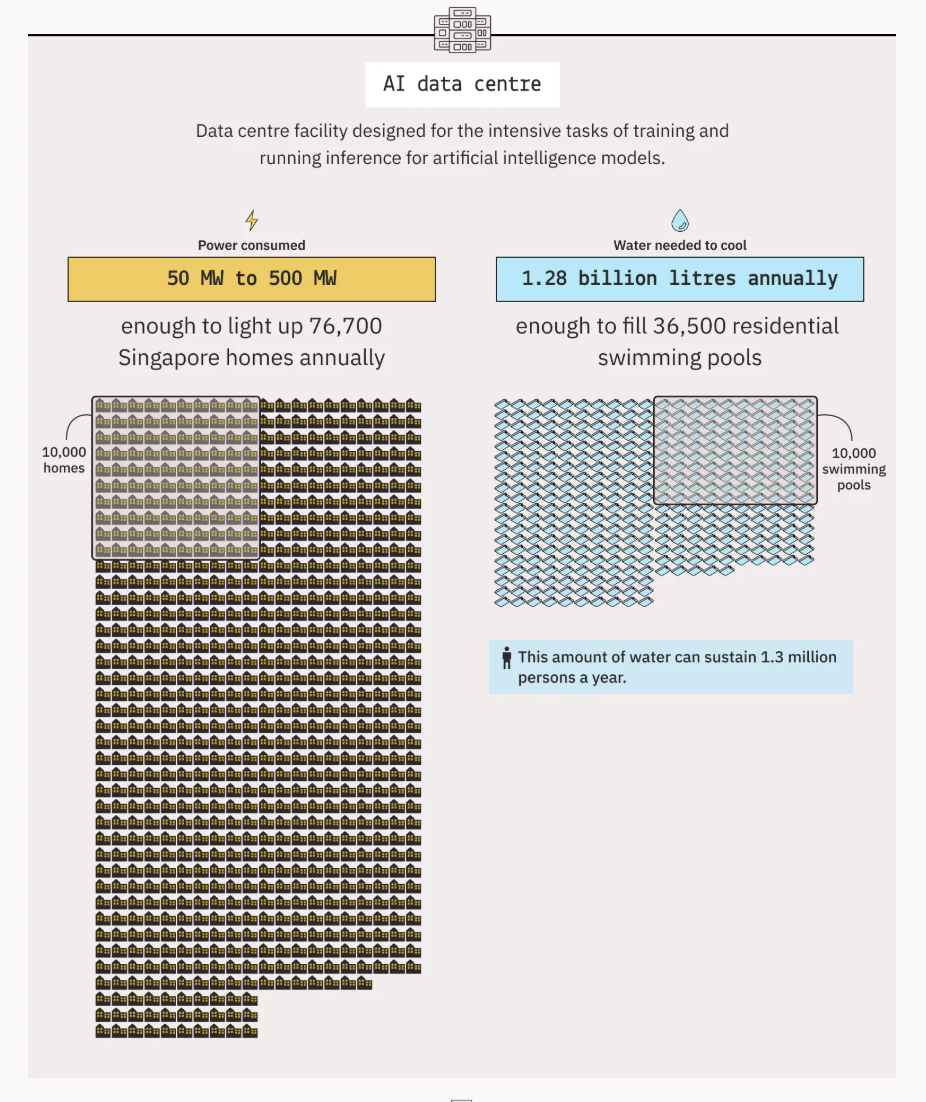
Image: Screenshot, Kontinentalist
When Singapore imposed a moratorium on new data centers in 2019, the construction boom shifted to neighboring countries. As part of a collaborative project, Dirty Data, by the Environmental Reporting Collective (ERC), Kontinentalist traced how the southern Malaysian state of Johor absorbed the spillover, growing from 10 megawatts of live data center capacity in 2021 to over 900 megawatts by the end of 2025. Annotated diagrams explain what a megawatt of data center capacity actually consumes — i.e. enough water and power to sustain over 76,000 homes annually, while bar charts visualize which countries hold the highest percentage of data centrer capacity. Operators collectively declared 1.2 gigawatts of electricity demand in Johor but consumed just over half of it by mid-2025, meaning that twice the environmental infrastructure was built for workloads that did not exist, with reporters raising the alarm about the extra strain the centers place on an “already fragile environmental ecosystem.”
Who Wins Money on Polymarket?
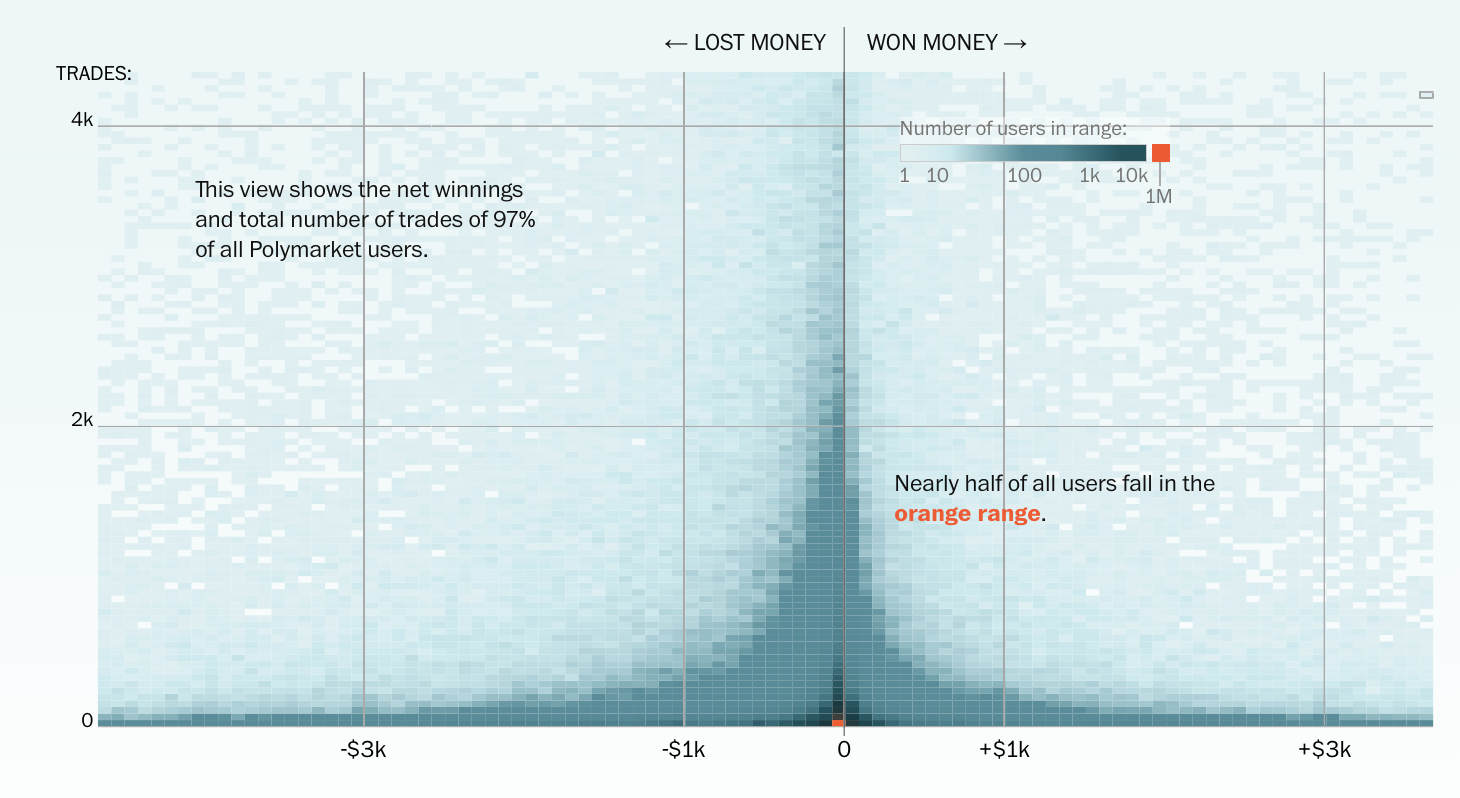
Image: Screenshot, The Washington Post
People who want to bet money on everything from election outcomes to the weather can use sites like Polymarket, a prediction market platform where users bet on the probability of future events. While the Polymarket advertising material says anyone can get paid for their “opinion,” The Washington Post’s data analysis reveals that most people end up losing money — “typically a few bucks” — while a small number of users have gained the most overall profits. In a series of comparative bar and line charts, the story finds that users are losing money at roughly the same rate as online gamblers betting on sports, with the odds of winning being only slightly higher on predicting weather or tech markets. Their verdict? “A lot of users aren’t that good at predicting the future.”
70 Years of Eurovision
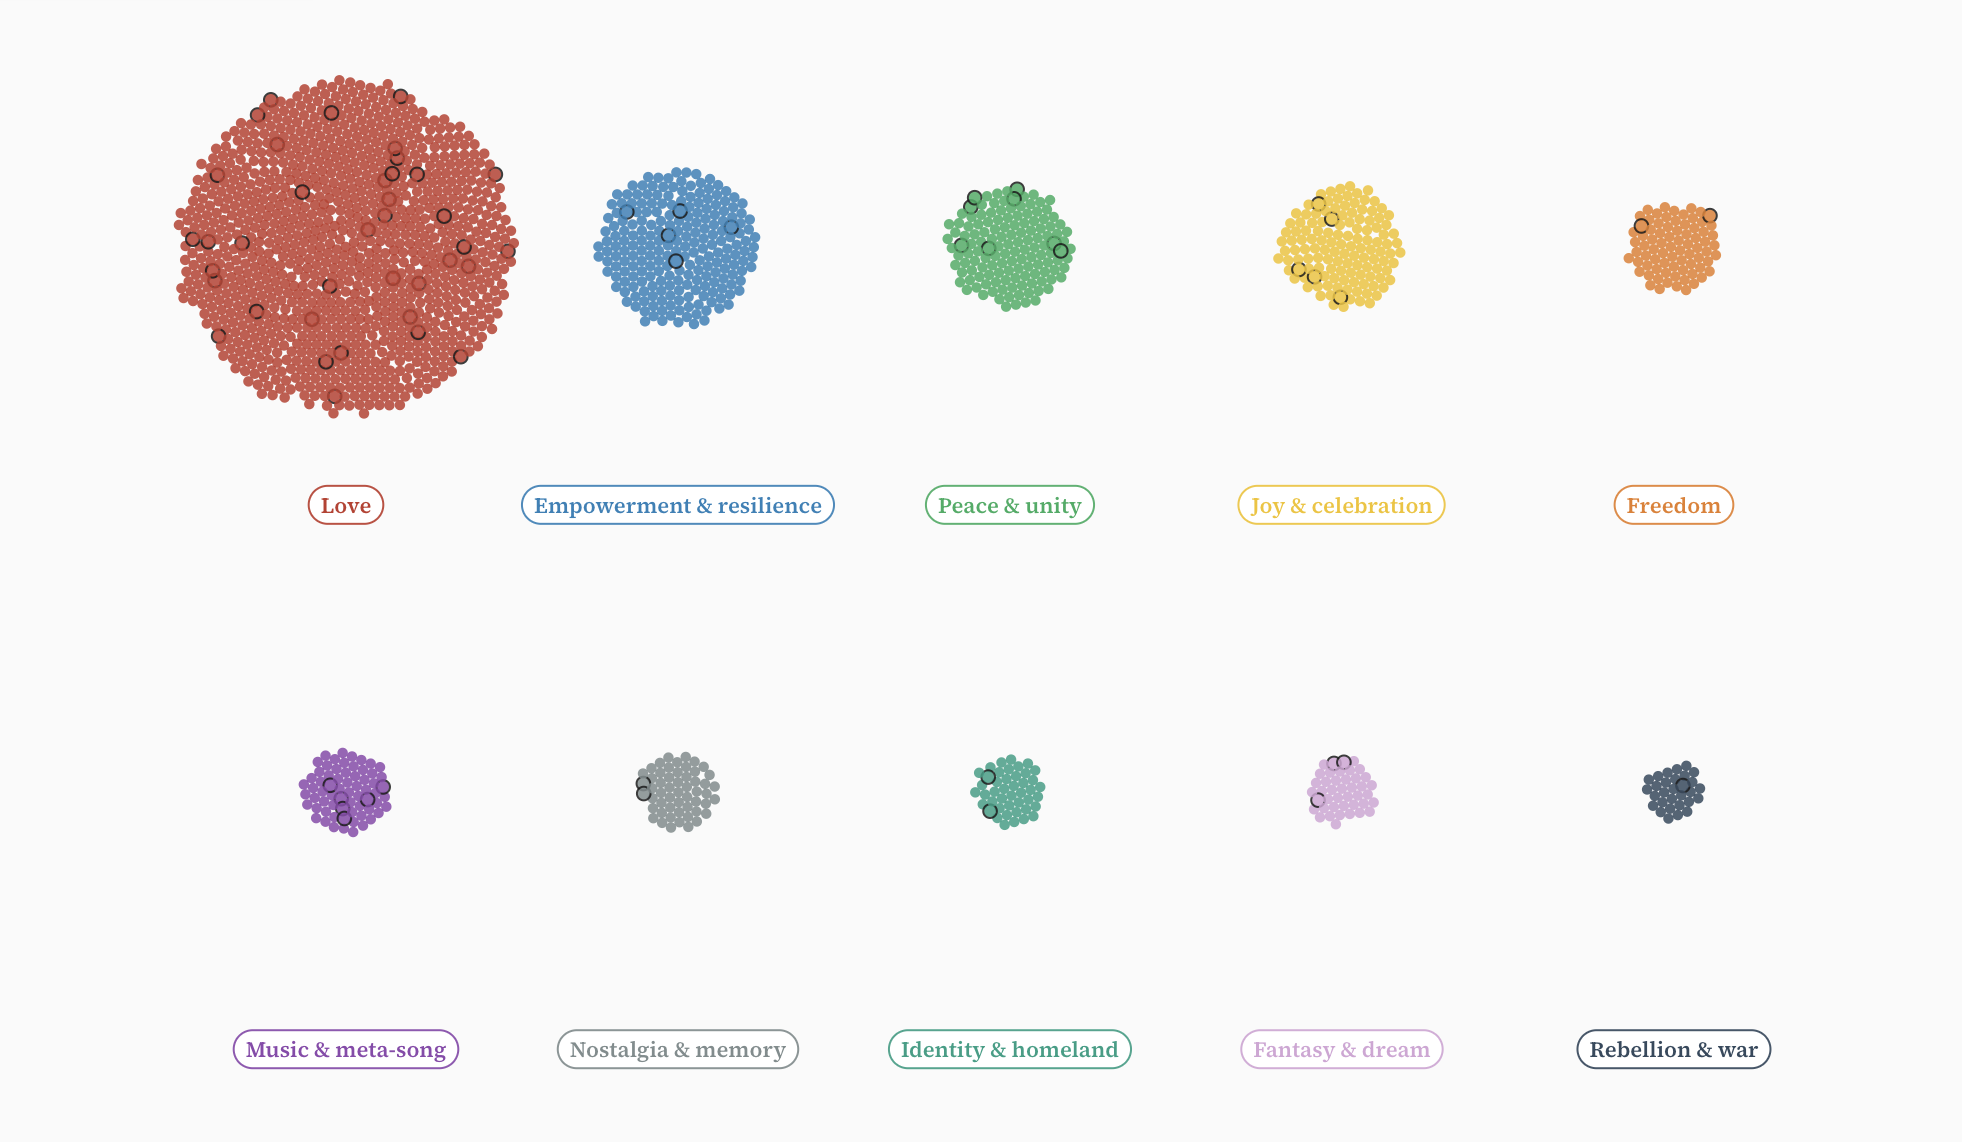
Image: Screenshot, puntofisso.net
The 2026 Eurovision Song Contest has just wrapped in Vienna, and a new data analysis reveals what seven decades of lyrics say about the contest. Giuseppe Sollazzo’s analysis of all 1,795 songs performed at Eurovision between 1956 and 2025 classifies every entry into one of 10 themes across a timeline. The piece then traces how those themes shift across the contest’s 70 years. The central visual is a single scrollytelling dot chart with one dot per song, by year, stacked by finishing position, which recolors itself as the reader scrolls to reveal theme, language, and word-frequency patterns. Love songs account for more than half of the songs across most of the contest’s history. Rebellion and war songs form the smallest theme yet spike in tandem with European conflicts. The story also reveals the frequency of certain words in lyrics over time. A language analysis mapped the contest’s distinct regulatory eras, from enforced national languages to English’s near-total dominance post-1999, with a quiet reversal beginning after Portugal’s 2017 win. An interactive explorer lets readers search any song, plot any word against any other, or filter by language.
Hanna Duggal is the writer of GIJN’s fortnightly Top 10 in Data Journalism column, and a data journalist at AJ Labs, the data, visual storytelling, and experiments team of Al Jazeera. She has reported on issues such as policing, surveillance, and protests using data, and reported for GIJN on data journalism in the Middle East, investigating algorithms on TikTok, and on using data to investigate tribal lands in the US.

Introduction to Investigative Journalism: Data Journalism

Introduction to Investigative Journalism: Following the Money

Reporter’s Guide to Investigating Cryptocurrency

Tipsheet on Partnering with Civil Society Organizations and Non-Governmental Organizations

From Toxic Supply Chains in Africa to Baltic Sabotage to Stolen Children in Syria: 10 Data Projects Win 2026 Sigma Awards

AI Healthcare Bias, Air Crash Analysis, Cocaine Seizures in Latin America, and Surviving Winter in a Ukraine Apartment Block

Visualizing a Trillion Dollars, India’s Warming Cities, Russian Mercenaries at Sea, and World Cup Player Physiques

US Science Research Cuts, Shadow Fuel from Iran, Trump’s Crypto Wealth, and Mapping Below Antarctica’s Ice

This work is licensed under a Creative Commons Attribution-NoDerivatives 4.0 International License
Republish our articles for free, online or in print, under a Creative Commons license.
Republish this article
This work is licensed under a Creative Commons Attribution-NoDerivatives 4.0 International License
Read Next
Data Journalism
From Toxic Supply Chains in Africa to Baltic Sabotage to Stolen Children in Syria: 10 Data Projects Win 2026 Sigma Awards
Ten outstanding data-driven journalism projects were chosen from among the 31 finalists – 26 individual projects and five portfolios — by a diverse prize committee of 17 judges.
Data Journalism Top 10
AI Healthcare Bias, Air Crash Analysis, Cocaine Seizures in Latin America, and Surviving Winter in a Ukraine Apartment Block
Our roundup of the best in recent data journalism also highlights US-Israeli attacks on Iran using radar satellite imagery, and how residents in a Ukrainian housing block survived winter after losing power.
Data Journalism Top 10
Visualizing a Trillion Dollars, India’s Warming Cities, Russian Mercenaries at Sea, and World Cup Player Physiques
Also highlighting how films portray Ukrainians, increasing tree cover in Spain, and how couples meet.
Data Journalism Top 10
US Science Research Cuts, Shadow Fuel from Iran, Trump’s Crypto Wealth, and Mapping Below Antarctica’s Ice
Our round-up of the best in recent data journalism also highlights a deadly train accident in Spain, new migration patterns from Venezuela, and Japan’s nuclear power resurgence.