
Tools for Measuring Your Group’s Audience and Impact
 Editor’s Note: The U.S.-based Institute for Nonprofit News (INN) recently hosted an online hangout for its members to discuss how to assess metrics and impact. Below is a wrap-up of tools and resources discussed in the training, which was led by Lauren Fuhrmann, associate director of the Wisconsin Center for Investigative Journalism.
As news publishers, it’s tempting to think of our analytics like the weather: they just happen to us. But it doesn’t have to be that way. By tracking our readers’ behavior and understanding what makes them act a certain way or click on a certain page, we can better understand how to recreate or manipulate their behavior the next time around. The following is a comprehensive list of tools to give you incredible insight into your readership.
Tools are free unless noted with a ($). Please share your experiences with any of these tools, or other tools you would add to this list, in the comments.
Resources:
Media Impact Project guide to impact assessment & metrics
Tools:
Created by Michael Keller and Brian Abelson, fellows at Columbia’s Tow Center for Digital Journalism, NewsLynx aims to help reporters understand what it means for a story to “do well” and what happened to cause that. It ties together analytics from Twitter, Facebook and Google and helps you track things like whether the story won an award, prompted legislative action, or simply generated discussion. Check out the duo’s report for a deeper explanation of how the tool works or contact@newslynx.org to sign up.
Podio is a project management tool available free to nonprofit organizations. Check out how WisconsinWatch used the tool to create a custom impact tracker.
Meltwater helps you track where your stories are getting picked up and lets you create an exportable spreadsheet that you can present to your funders.
Mention.net ($)
Mention.net allows you to see your where your story or topic is getting mentioned in real time, but you can also track those mentioned over a certain period and get an exportable document.
Google Alerts sends you an email every time a keyword or phrase is mentioned on the internet. If your budget is tight, set up a Google alert for the items you’re trying to track and enter that data into a spreadsheet manually.
Use Batchgeo to make simple maps of where your story has been picked up. Copying and paste your data from a spreadsheet and Batchgeo will create the map.
This is a tool you can sync with your own Google Analytics to deliver reports on the site activity measures that truly matter to a publisher, including sessions, top stories, devices and more.
Chartbeat ($)
Chartbeat is a lot like a better version of Google Analytics, in real time. Chartbeat wasborn and bred in the newsroom and is intended for publishers to see what their readers are doing at any given moment on their site (really, it checks every 15 seconds).
Twitter analytics helps you figure out which of your tweets has received the most impressions and engagements, plus which of your latest followers have the biggest following.
Buffer ($)
Buffer is a tool to help schedule all of your social media posts. It is integrated with Google Analytics to give you all the standard services you’re used to, plus data on how your following is growing over time.
SocialBro ($)
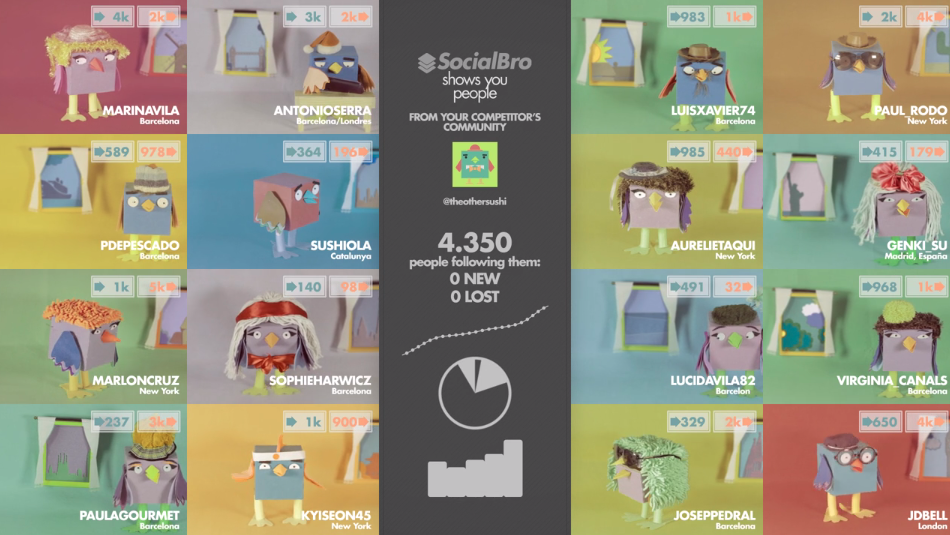 SocialBro is Twitter Analytics on steroids. The main dashboard shows recent followers (or unfollowers), and who you’re following that isn’t following you back. It generates reports on the best time to tweet to your target audience, as well as demographic information such as what languages your followers speak and what time zones they’re in.
SocialRank helps you sort and organize your followers based on who is engaging with you the most. It generates lists that you can export to Twitter.
Facebook delivers information on your page’s likes, as well as the reach and engagement of your posts. You can pick the date ranges to see if you did better while you were posting about a particular story, and also see when the people who like your page are online.
Take any link from your site, paste the URL into this tool and it will tell you how many times that link was shared on Facebook, Twitter, etc.
PixelPing is a snippet of javascript code added to stories you sent to your media partners. It’s a very lightweight script so it doesn’t make things load slowly and doesn’t affect the layout of your page. It records every time someone visits that page and sends those metrics to the location where you can view them. It was developed by INN member ProPublica.
This post originally appeared on the INN Website and is reprinted with permission.
 Laura Bertocci is membership coordinator of the Institute for Nonprofit News. She has spent time as a photographer on Capitol Hill, a small-town reporter, a big city reporter, and a researcher on conflict journalism in Valparaíso, Chile in 2012. @LEBertoc

Measuring and Increasing the Effects of Investigative Journalism

Reporter’s Guide to Investigating Cryptocurrency

Tipsheet on Partnering with Civil Society Organizations and Non-Governmental Organizations

AI Accountability Reporting Guide

Measuring Journalism’s Impact — What We Know Now That We Didn’t Before

Mastering the Rollout: Increasing the Impact of Your Investigative Story

Do You Have ‘the OSINT Mindset’?: Try Our Quiz for Those Who Like ‘a Little Light Online Sleuthing’

Building an Engaged Community through Collaboration and In-Depth Investigations, All While Maintaining a Sense of Humor

This work is licensed under a Creative Commons Attribution-NoDerivatives 4.0 International License
Republish our articles for free, online or in print, under a Creative Commons license.
Republish this article
This work is licensed under a Creative Commons Attribution-NoDerivatives 4.0 International License
Read Next
Methodology Sustainability
Measuring Journalism’s Impact — What We Know Now That We Didn’t Before
Recent research suggests that the effects of investigative and collaborative reporting are more far-reaching on the journalism community than we had imagined.
News & Analysis Sustainability
Mastering the Rollout: Increasing the Impact of Your Investigative Story
GIJN social media editor Holly Pate looked into best practices for increasing impact and audience engagement of investigative stories, gathering real-life examples from journalism sites around the world.
Investigative Techniques Reporting Tools & Tips Teaching & Training
Do You Have ‘the OSINT Mindset’?: Try Our Quiz for Those Who Like ‘a Little Light Online Sleuthing’
The most important thing to learn if you wish to integrate elements of OSINT into your investigative practice is the overall mindset behind the approach.
Member Profiles
Building an Engaged Community through Collaboration and In-Depth Investigations, All While Maintaining a Sense of Humor
This small Lithuanian outlet Siena punches above its weight by publishing agenda-setting stories — but the founders say they also never want to take themselves too seriously.