Accessibility Settings

color options

monochrome muted color dark

reading tools

isolation ruler

Tag

Ukraine

62 posts
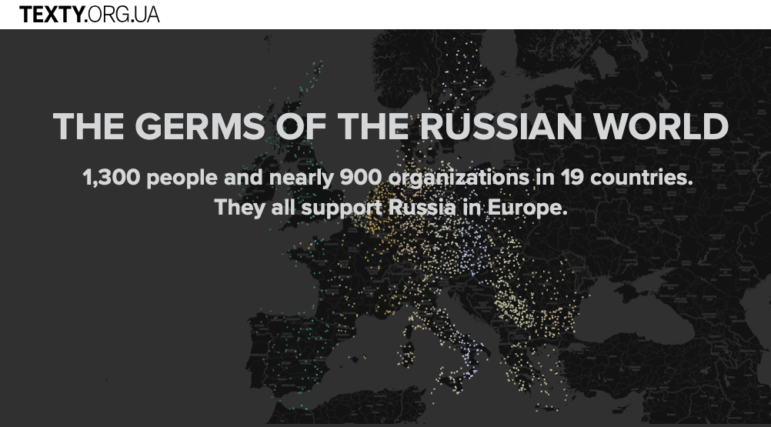
Texty.org Map of Russian lobbists

Data Journalism Data Journalism Top 10

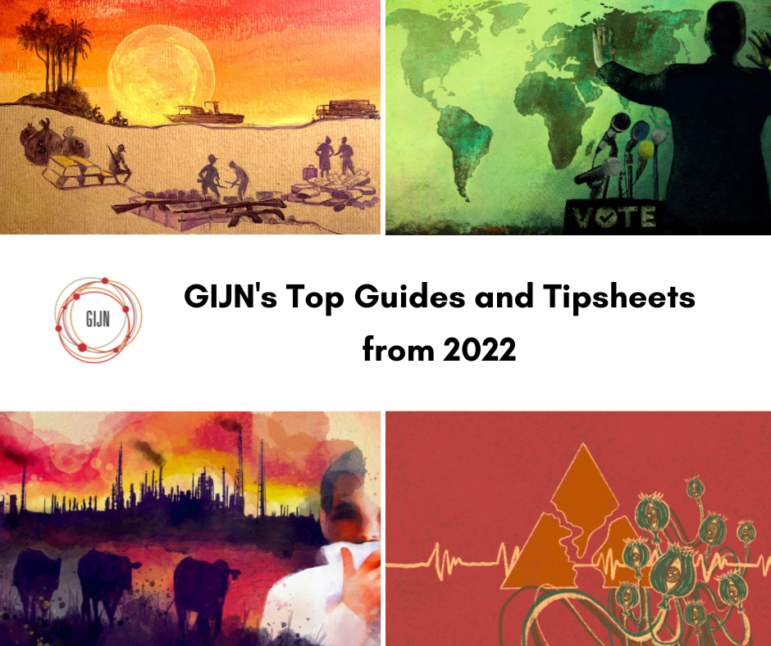
Editor’s Pick: Top 10 Data Journalism Projects from 2022

Throughout 2022, journalists have used data projects to track and assess the Russian invasion of Ukraine, the ongoing impacts of climate change, and important political elections around the world. Here, GIJN selects our top 10 data journalism projects of the year, which also includes a look at the polarization of the COVID vaccines in the US, a historical analysis of how debt burdened Haiti for centuries, irregularities in Spanish caesarean delivery rates, and the privatization of UK’s water resources.

Data Journalism

Data Journalism Top 10: Queen Elizabeth’s Reign, Arctic Fires, Taiwan Street Food, Brain Drain

Our weekly NodeXL and human curation of the most popular data journalism stories on Twitter features The Financial Times’ 10 charts visualizing developments in the United Kingdom during Elizabeth’s reign, The Marshall Project’s look at how government Covid-19 relief funds were used, and Taiwan Data Stories’ scrollytelling project about Taiwan’s iconic street food.

Scientific American - Florence Nightingale graphics

Data Journalism

Data Journalism Top 10: Kids’ Fashion Stereotypes, Economic Sandwich Index, Immigration Profits, and Florence Nightingale’s Graphics

Children’s fashion is riddled with gender stereotypes, according to an analysis by German newspaper Süddeutsche Zeitung, which found that popular children’s clothing tended to be more revealing for girls, but comfortable and functional for boys. Also this week, analysis of the big earners in the healthcare industry, the tracking of post-pandemic recovery through sandwich sales, and Florence Nightingale’s contribution to graphic storytelling.

CBC heat islands graphed by economic diversity

Data Journalism

Data Journalism Top 10: Sweltering Cities, Digital Inequity, Climate & Sleep, COVID & Schools

As parts of the world endure record-breaking temperatures, a highlight from the world of data journalism this week involves an analysis of how “heat islands” in Canadian cities vary based on economic strata. Our weekly Top Ten in Data Journalism also looks at the global spread of Pegasus spyware, digital inequity in the US, and how the COVID-19 pandemic affects school children in Latin America.