Data Journalism Data Journalism Top 10
Data Journalism Top 10: Global Migration, EU Pesticides, Russian Occupation, a Congressman’s Lies
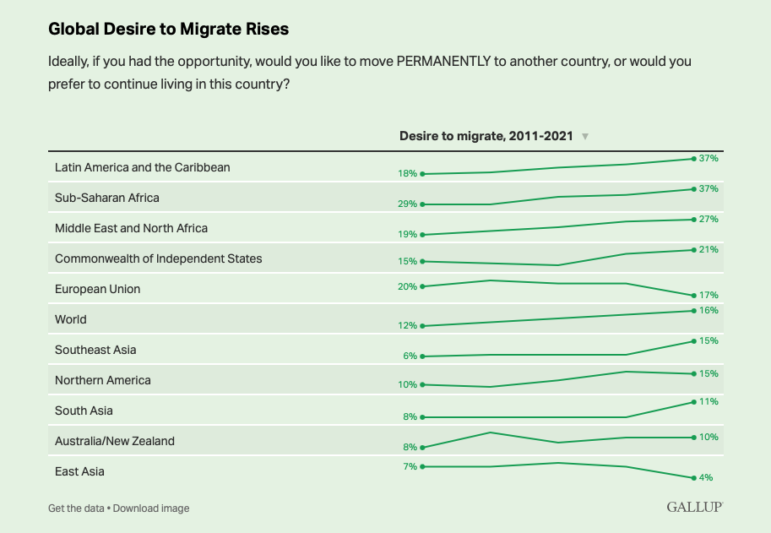
Our weekly look at the most popular data journalism stories on Twitter reveals a global urge to migrates as well as analyses of a US Congressman’s lies, the use of pesticides in EU apple farming, the online patterns of Brazil’s coup plotters, and an interactive US snowfall chart.