Data Journalism Data Journalism Top 10
Data Journalism Top 10: Native American Remains, Disparities in French Education, and Caste Discrimination in India’s Academia
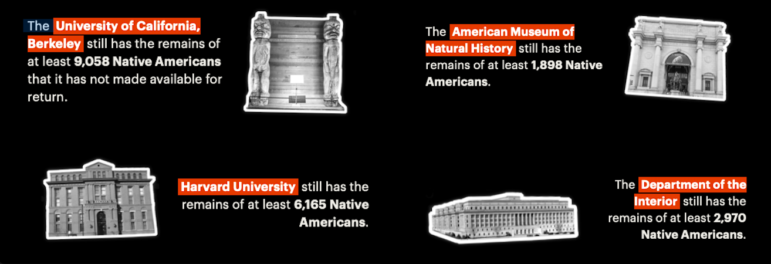
Our most popular data journalism stories of the week highlight a project cataloging Indigenous remains in the US that have yet to be repatriated, a look into the socioeconomic disparities between French school districts, a deep dive into how caste discrimination affects India’s academia, and a German examination of 100 years of student housing.