
GIJN’s Data Journalism Top 10: Democratic Data, Berlin’s Bicycles and Cricket Crazy
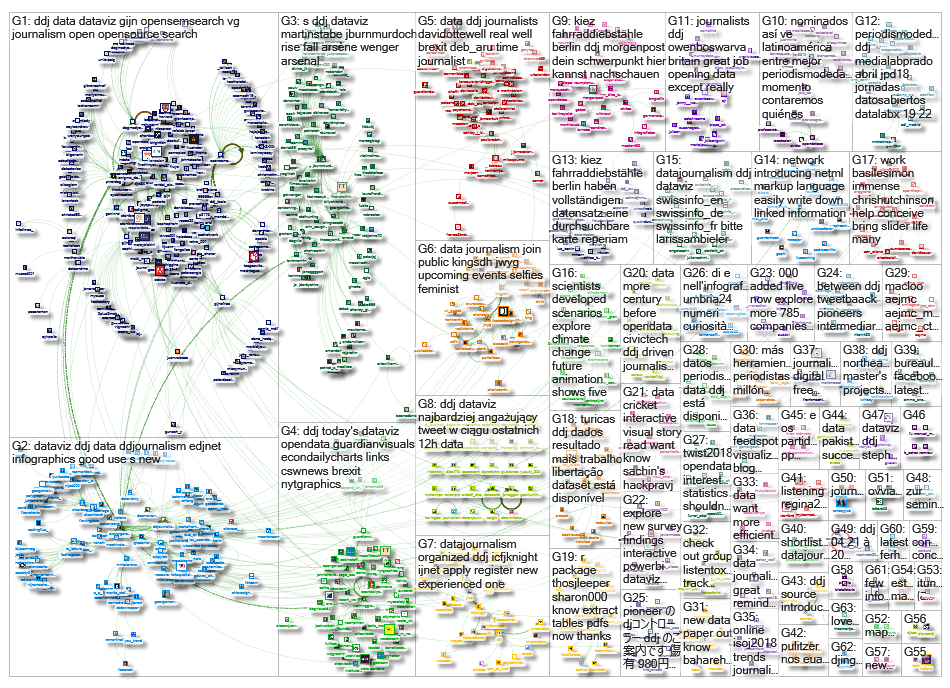
 What’s the global data journalism community tweeting about this week? Our NodeXL #ddj mapping from April 16 to 22 finds @camellia_will debating the future of data portals, @DLeonhardt using hard data to show whether Democratic or Republican presidents were more fiscally responsible and @morgenpost mapping bicycle thefts hotspots in Berlin.
The Future of Data Portals
Open data and data portals don’t change the world. Simply putting the data out there isn’t enough, it takes a team of data scientists, designers, developers, subject matter experts, storytellers, project managers and everything in between to make data accessible, usable and useful.
Important piece by @camellia_will : The future of data portals. https://t.co/rfymnL59Uy pic.twitter.com/Ue5o4A8U5Q
— Nicolas Terpolilli (@nterpo) April 17, 2018
Data for Democrats
New York Times op-ed columnist David Leonhardt points out that Democrats have repeatedly reduced America’s deficit, based on data from the Congressional Budget Office. Since 1977, the three presidential administrations that have overseen deficit increases were all Republican while the three administrations that have overseen deficit reductions were Democratic.
.@DLeonhardt: Democrats are the party of fiscal responsibility https://t.co/EDu6Z7JHgn pic.twitter.com/QHkhuCTG6V
— Catherine Rampell (@crampell) April 16, 2018
Mapping Bicycle Thefts
Berliner Morgenpost maps bicycle thefts in Berlin and finds the Pankow, Kreuzberg Graefekiez and Friedenau districts the hotspots of stolen bicycles. In 2017, on average, a bicycle disappeared every day in these areas.
??♀️ Cycling in Berlin is an amazing experience. Getting your bike stolen can also be part of the game, though. @datentaeterin has mapped the most risky areas on @morgenpost: https://t.co/k7KWF3QVqB #Fahrraddiebstähle ?
— Jacopo Ottaviani (@JacopoOttaviani) April 19, 2018
Why Data Needs Feminists
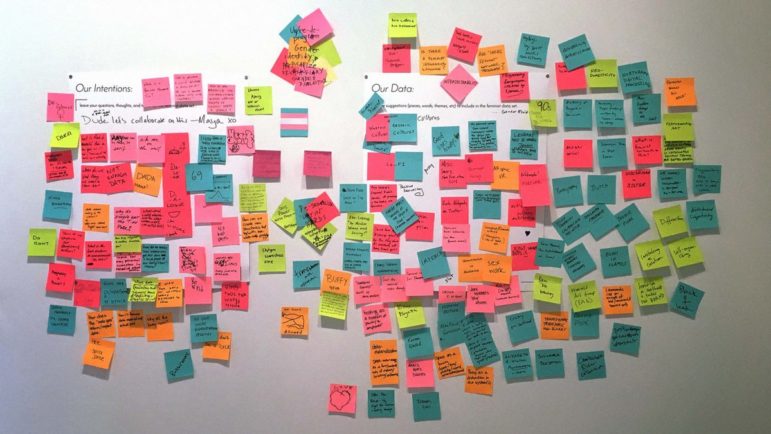
A 2015 study found that Google is less likely to show advertisements for highly paid jobs to women than it is to men. These biases can result from flaws in the algorithm itself, or the data it was trained on. Machine learning designer Caroline Sinders is trying to create a more equitable and ethical data collection by starting the Feminist Data Set project.
“How do you think about data sets as protest? I think it’s important as a technologist and artist to look at the systems you exist in and think of ways to make them better or protest them or intervene in them.” https://t.co/Sh3H8dYvOm
— Tracy Chou ??♀️ (@triketora) April 18, 2018
VisiData: New Open Source Tool
VisiData is an open source multitool for data exploration and manipulation. The software developer who wrote the program calls it “a swiss army chainsaw for data.” There’s a lightning demonstration here.
Exploring data on the command line with VisiData https://t.co/LiC6lIMY97 #dataviz #ddj #vg pic.twitter.com/HIG5Ia4Nlf
— Pınar DağⓋ (@pinardag) April 20, 2018
European Data Journalism Network
The European Data Journalism Network’s editorial coordinator Gian-Paolo Accardo gives an overview on how and why the edjnet was set up and the tools it has developed for journalists and the public.
The double challenge of explaining Europe through data https://t.co/bIH40eM5L0 @edjnet @ddjournalism #ddj pic.twitter.com/Mb2BNk6e0d
— Duc Quang Nguyen (@duc_qn) April 16, 2018
Open Data?
Journalist SA Mathieson, author of the e-book Britdata, says Britain gets maximum marks for releasing data on the government’s budget, national statistics, administrative boundaries, national maps, air quality and company registers. But the government’s handling of data it does not want to release is disappointing, with security often cited as an excuse.
This is becoming too common in countries with otherwise robust #opendata policies. FOIA should be strengthened by the open data movement, not replaced. https://t.co/G9UIOxdmNY
— ThinkData Works (@thinkdataworks) April 18, 2018
Cricket Fever
Software developer Pravendra Singh expresses his love for the game of cricket in a piece with multiple interactives, from a historical timeline of test matches performance to the debut age distribution of successful cricket players. As a bonus, there’s also a random team generator to generate your favorite team.
Thanks @puddingviz for the inspiration and @codenberg for the scrollama library that helped me create my first scroll driven data story.https://t.co/kpa7c7AHNK#DataViz pic.twitter.com/VQPiANkxTx
— Pravendra Singh (@hackpravj) April 18, 2018
Brazil’s Coast Water Quality
Software developer Álvaro Justen uploaded online datasets from the Institute of Environment and Water Resources of Bahia on water quality on the coast of Bahia in Brazil.
??? Resultado de mais um trabalho de libertação de dados! O dataset está disponível em: https://t.co/zCB8dkfZFf #opendata #ddj #python https://t.co/MtZylWAdnK
— Álvaro Justen (@turicas) April 20, 2018
Expanding OCCRP Data
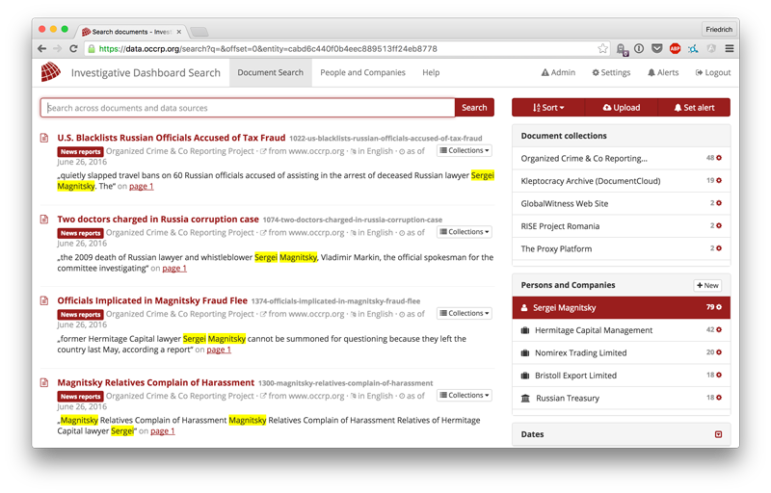
New data sources are constantly being added to data.occrp.org. You’ll be able to find new stuff on Czech companies’ directors and shareholders, UK land prices, data related to the #DaphneProject and #Golden Visas, and more.
We’re adding sources to https://t.co/9QVPsIbQ1x all the time now, here’s some fresh bits from the Czech Republic and the UK:
— Friedrich Lindenberg (@pudo) April 19, 2018
Thanks, once again, to Marc Smith of Connected Action for gathering the links and graphing them.
 Eunice Au is GIJN’s program coordinator. Previously, she was a Malaysia correspondent for Singapore’s The Straits Times, and a journalist at the New Straits Times. She has also written for The Sun, Malaysian Today and Madam Chair.


