Accessibility Settings

color options

monochrome muted color dark

reading tools

isolation ruler

Tag

datasets

12 posts

Data Journalism

Data Journalism Top 10: Election Forecasts, The Sweatpants Era, Hong Kong Protests, DJ in Eastern Europe & Caucasus

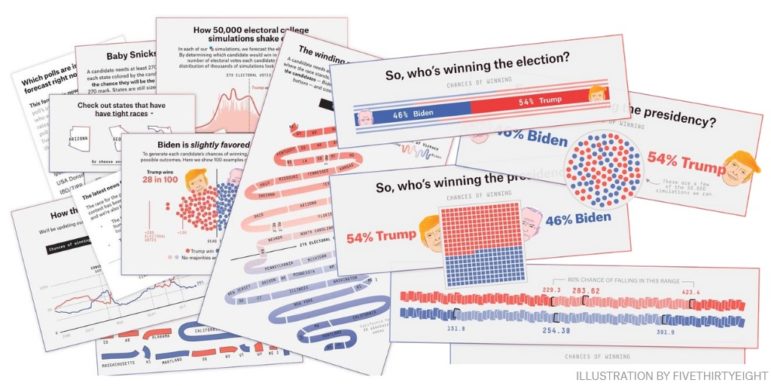
One of the biggest issues that comes with visualizing election forecasts is how to incorporate uncertainty in a way that is understandable to readers. Our NodeXL #ddj mapping from August 10 to 16 finds FiveThirtyEight explaining their election forecast design process and considerations. Elsewhere, The New York Times Magazine has been digging into the collapse of the fashion industry, and the Hong Kong Free Press is teaming up with the Journalism and Media Studies Centre of The University of Hong Kong to expand its protest research archive.

Data Journalism

GIJN’s Data Journalism Top 10: Plastic Mountains, #SharpieGate, Stopwatch Analysis, Collaborative Software

What’s the global data journalism community tweeting about this week? Our NodeXL #ddj mapping from September 9 to 15 finds ProPublica open-sourcing its collaborative reporting software; CityLab interviewing Mark Monmonier, author of “How to Lie With Maps,” on Donald Trump’s deceptive hurricane map; Al Jazeera surveying South Sudan’s citizens on displacement; and Reuters visualizing just how bad the Earth’s problem is in terms of single-use plastics.

Data Journalism

Struck by Lightning: A Quick Lesson on Cleaning up Your Data

Being struck by lightning is often used as an example of heavenly retribution because it is so unlikely. Fatalities due to lightning are statistical outliers, since most people struck by lightning survive. So what is the best way to avoid becoming one of these outliers? The following is a step-by-step set of instructions for unpacking a dataset – and being careful about the conclusions we draw.

Data Journalism

GIJN’s Data Journalism Top 10 in 2018: Visual Vocabulary, Eclectic Visualization, Google Dataset Search, Laughing in Parliament

It’s been a great year for data journalism and visualizations. GIJN’s Top 10 #ddj series captured snapshots of what’s popular on Twitter among the global data journalism community for 46 weeks in 2018. For this edition, we asked NodeXL to map 2018’s most popular #ddj tweets from January 1 to December 11 and the results are in. This year’s most popular tweets include @FinancialTimes’ ever-popular Visual Vocabulary chart, @Google’s Dataset Search, @hnrklndbrg’s eclectic visualizations, and @SZ’s analysis of Germany’s parliamentarians using laughter as a debate weapon.

Data Journalism

GIJN’s Data Journalism Top 10: German Heat, Austrian Arms, Quebec School Fees and Salvadoran Kidney Disease

What’s the global data journalism community tweeting about this week? Our NodeXL #ddj mapping from Sept 3 to 9 finds @FiveThirtyEight attacked by the green-eyed monster with their equivalent of Bloomberg’s “Jealousy List,” @daswasfehlt breaks down Austria’s export of arms, @GoogleAI announces the beta launch of Google Datasets Search, and @SZ documents how climate change is wreaking havoc on temperatures in Germany but boosting ice-cream sales.

Data Journalism

GIJN’s Data Journalism Top 10: Dam Disaster in Laos, Global Star Gazing, Why We Love Pie Charts

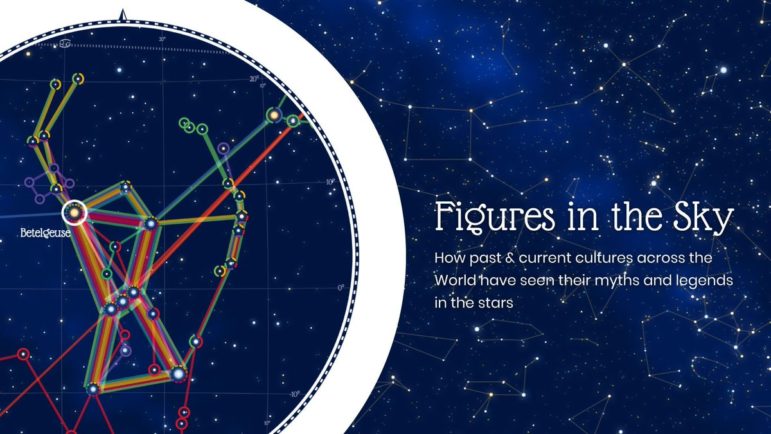
What’s the global data journalism community tweeting about this week? Our NodeXL #ddj mapping from July 23 to 29 finds @NadiehBremer visualizing beautiful constellations imagined by different cultures, @mslima diving deep into why we love pie charts, @leigh_tami18 explaining the various methods of joining datasets and the Reuters Graphic’s team visualization of the dam disaster in Laos.

Data Journalism

GIJN’s Data Journalism Top 10: Democratic Data, Berlin’s Bicycles and Cricket Crazy

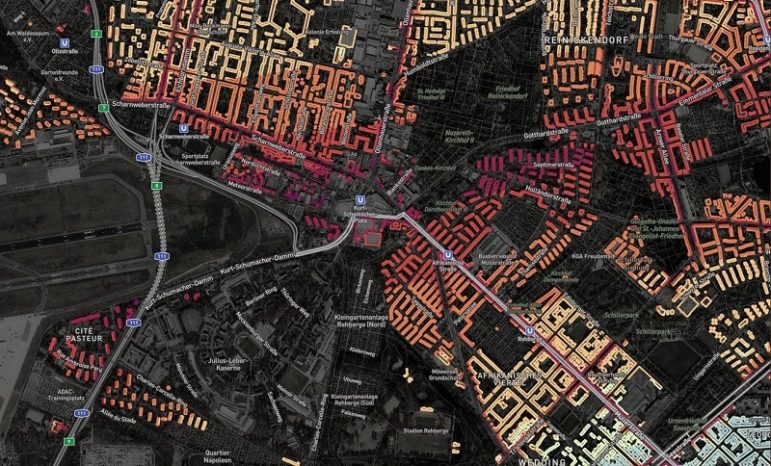
What’s the global data journalism community tweeting about this week? Our NodeXL #ddj mapping from April 16 to 22 finds @camellia_will debating the future of data portals, @DLeonhardt using hard data to show whether Democratic or Republican presidents have been more fiscally responsible and @morgenpost mapping bicycle thefts hotspots in Berlin.

Data Journalism

GIJN’s Data Journalism Top 10: Ethics, Awards and Open Source for IJ

What’s the global data journalism community tweeting about this week? Our NodeXL #ddj mapping from April 9 to 15 finds an ultra useful data visualization tool that is perfect for non-programmers by @Adobe and @GeorgiaTech, a list of 99 amazing data journalism works by @GENinnovate’s Data Journalism Awards nominees and @CARTO shares 50 experts on location intelligence to follow.