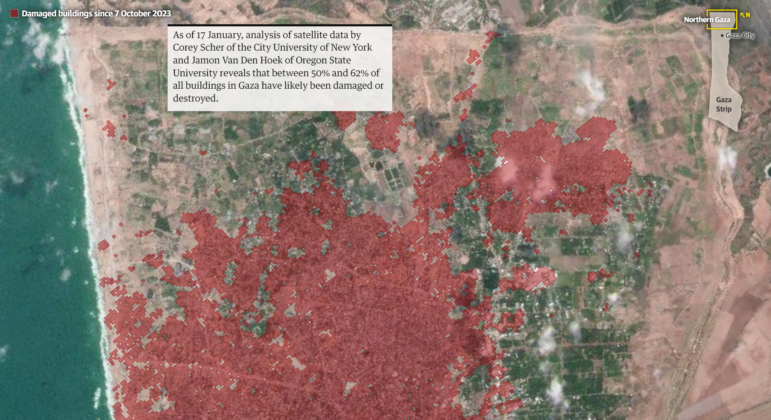
One of the reports published using data from the duo. Image: Screenshot
Mapping Conflict: Using Satellite Radar Data to Track the War Damage in Gaza
Read this article in


Editor’s Note: This is the second in a series of stories where GIJN will be looking at the intersection of investigative journalism and the ongoing war in Gaza between Israel and Hamas. Our first installment, a round-up of notable investigative journalism about the war so far, was published last week.
War has brought a profound change to Gaza’s urban landscape. In little over five months, more than half of the buildings in the strip have been damaged or destroyed.
Israel’s military campaign — launched in response to the October 7 Hamas assault across the border — has impacted homes, schools, and infrastructure.
Gaza’s health ministry says more than 30,000 Palestinians have been killed so far, around two-thirds of them women and children. But with persistent internet outages isolating Gaza’s 2.3 million residents since the war began, blockades and fuel shortages, and the challenges of reporting from a conflict zone effectively sealed off to international reporters, relaying events on the ground has been incredibly difficult. As a result, mapping the damage has been indispensable to reporting the impact of the war.
Soon after the conflict started, Jamon Van Den Hoek, an associate professor of geography at Oregon State University and the head of the Conflict Ecology lab, a geospatial research unit, began working with Corey Scher, a PhD candidate at the City University of New York (CUNY) Graduate Center, using satellite radar to document small changes in the characteristics of the landscape in Gaza.
Using methods designed to map damage after earthquakes, they have been able to build up an elaborate picture of the scale of the impact, and now estimate at least 54% of buildings in Gaza have likely been damaged or destroyed.
The maps the duo have produced have appeared on the BBC, in The New York Times, and the Financial Times. A recent investigation by the Guardian’s visual storytelling team — which also used their data — analyzed mass destruction across three neighborhoods in Gaza, finding damage to more than 250 residential buildings, 17 schools and universities, 16 mosques, three hospitals, and three cemeteries. Their work has also been quoted in a United Nations report which indicates it may take decades to recover and rebuild “the shattered infrastructure of Gaza.”
GIJN interviewed Van Den Hoek and Scher to ask about conflict mapping in Gaza, how satellite radar data can help build up a picture of what is happening on the ground, and the pertinence of collaborating with journalists. The interview has been edited for length and clarity.
GIJN: What struck you most while mapping this particular conflict?
Jamon Van Den Hoek: I guess there are a lot of things that have struck us. The duration of the conflict and the speed of it and the intensity of it has caught everybody off guard. In the early days when we were making these maps, we were kind of surprised we were getting anything [but] the damage was so fast and it filled up the map so quickly, and it continued to do that.
Also one thing that’s surprised me is the uptake of the maps and data. There’s such a need for this kind of awareness. At least it certainly seems that way from how journalists are making use of the data to understand what’s happening, not at a single location, but what’s happening across the breadth of Gaza.
GIJN: Has it been like any other conflict you’ve observed?
Corey Scher: Jamon has been working on this in many regions affected by conflict for over a decade. Over the last two years, we’ve been working together on Ukraine to develop a similar methodology. Generally our shtick is to use earth observation data to study the impacts and geographies of conflict and conflicted societies.
JVDH: As far as how it compares to others, certainly the intensity of it has been unique. Other Israeli military operations [in Gaza] have been much more small-scale, really localized, or have had minimal structural damage or been short in duration. This one far and away exceeds all of these past military operations at least in the last decade. This one is just really exceptional.
GIJN: What techniques have you used to estimate the destruction in Gaza?
CS: We’re using a set of methods that originate from a literature designed around mapping damage after earthquakes using satellite radar data. The subdiscipline of this is called interferometry. And the specific method is called coherent change detection. Those are scientific words, but in a qualitative sense, what we’re doing is analyzing many years of satellite radar data to look for small changes in the echoing characteristics of radar waves.

The latest damage assessment of Gaza by the pair. Image: Screenshot, Decentralized Damage Mapping Group
We’re able to analyze these satellite radar data over time to look for changes in indicators of stability [so] we can identify areas that are urban or that are more or less stable before an event — in this case the war in Gaza — takes place. During, or after, an event we can monitor those previously stable areas for signs of destabilization.
GIJN: How would you summarize that in terms of what you’re actually seeing on the ground?
CS: We’re seeing previously stable regions destabilized, and we know that because satellite radar is sensitive to the 3D structure and arrangement of an area. So, it’s a different way of looking at a region versus a picture.
JVDH: Another way we say it is: It’s a sharp, sudden, and sustained drop in stability.
GIJN: What do satellite optical images fail to pick up on that you can pick up on with radar?
CS: In a war zone, you’re not always going to be able to see damage from directly overhead, which is how satellite optical images are usually acquired. But when we look at these regions using radar, we can see indicators of damage that would not always be visible from above. So imagine the side of a structure being damaged and then looking at it from directly overhead, you probably won’t be able to see that damage on the side, especially in a place like Gaza City where the built area density is so high, they’re built so close together that you’ll see these reports from the ground of streets with vast amounts of damage but you might not see that damage in even the most high-resolution satellite optical data. [But] because satellite radar is sensitive to structural characteristics at the centimeter and millimeter scale — it’s a different way of looking.
GIJN: How important is it to collect localized, on-the-ground data, when images from radar and satellite observation are available?
CS: Journalists and humanitarian actors are some of the first people to have reports on — or know — what’s actually going on in a war zone. So as scientists, we need to collaborate with them to know where to look, and what to look for, and when. As reports emerge of fighting or aerial bombardment, we are able to look for those types of changes and see if we can confirm them.
JVDH: There are a lot of things where we simply don’t know what’s happening from space without on-the-ground observation. Building damage is what we’re after, but within that signal, there’s other things that influence what we see. One thing we were surprised to see was the arrival of internally displaced people (IDP) tents into our signal. We realized through on-the-ground reporting that the presence of IDP camps had to be taken into account. They were actually influencing our detection and giving us false alarms. To our sensor it was just a bunch of new structures.
GIJN: On a technical basis, has there been anything that’s been challenging?
CS: The methods we are using are meant to detect changes in structural characteristics of an area. And, as there’s been so much displacement [of people], the landscape is so dynamic that there are a lot of changes to it that we need to account for.
JVDH: One thing we’re really grappling with is trying to have a consistent baseline so that we can have an apples-to-apples comparison. We’re trying to do this in real time, which we’ve never really done. And in fact, no one’s ever really done it in such a consistent way, where we’ve now released 18 different maps [at time of interview] of the conflict over a very short period of time. Keeping the perspectives stable and comparable has been a challenge. So, every time we make these tweaks, we have to basically recalculate the entire retrospective. Having that kind of consistency has been really important for the reporting and communication with journalists and trying to be very transparent about changes that we see and about limitations of the data.
GIJN: How do you validate your findings?
JVDH: No [researchers] have access to the ground, which is the gold standard. We expect to once the conflict ends. So, like every other group, we do our best to triangulate different sources of data. We compare our maps with the maps produced by the UN.
The work that’s done by journalists like in the Guardian piece where they did such an expansive assessment of sites of building damage is really useful to us. The New York Times did a piece on intentional demolitions of dwelling structures across Gaza… All of those geolocations that journalists build up are really useful to us.
We are also using open source data collection approaches, looking at images and videos where we can identify their locations and interpret what’s happening in the image with regard to building damage. We have this sort of gut check every time we make a new map where we look at where we see the most new data at the governorate level. And, then we look at what’s been reported as to where the fighting has been.
GIJN: Can you comment on the evolution of remote sensing?
CS: We wouldn’t have been able to do this in real time, recording with this type of rigor, a few years ago, but the advent of new cloud-based processing tools has really accelerated how quickly we can do these analyses. The satellite radar constellation that we use from the European Space Agency didn’t exist until 2014, and it was the first openly accessible satellite radar constellation with regular repeats over areas.
JVDH: Making estimates of building damage via satellite has been done… But, the difference is that those are often done by people that don’t really engage with conflict dynamics. I think what we have done is develop a conceptual model to just better understand what to look for and when, and how to be sensitive to the different dynamics in a conflict environment.

Palestinians inspect a destroyed building after an airstrike in the city of Khan Younis, in the southern Gaza Strip, on March 12, 2024. The researchers say some indicators of damage are not always visible from above. Image: Shutterstock
GIJN: What tips would you give to journalists?
JVDH: Reach out to scientists doing this work and build these collaborative networks. I think if Gaza is showing anything, it’s that power of collaboration.
CS: That’s what I was going to say. Just as satellite data are emergent in reporting on things, collaborating with journalists is new for scientists.
GIJN: Your maps have been used by many organizations in many different countries. Do you think that’s indicative of a shift, and will that level of collaboration continue?
CS: I hope so. We’ve been doing this for a long time and in pretty siloed conditions. And, now it’s different and there’s a horrible tragedy underneath it all. I think it’s important to illuminate the scale of conflict and that you really need a zoomed out perspective that’s informed by our understanding of what’s going on the ground. And you can’t do that without these collaborations.
GIJN: You’re observing things from afar, but how does this work impact you as individual researchers?
JVDH: This war has impacted me, and I think Corey as well, really profoundly. I think the map of damage that we make is, to be honest, increasingly difficult to look at even though it doesn’t show humanity, it doesn’t show loss of life. But the connections are just clearer than ever before that it’s just a proxy for all this horror and suffering. I would say it’s the most difficult assessment we’ve ever done.
 Hanna Duggal is a data journalist at @AJLabs, the data, visual storytelling and experiments team of Al Jazeera. She has reported on issues such as policing, surveillance, and protests using data.

This work is licensed under a Creative Commons Attribution-NoDerivatives 4.0 International License
Republish our articles for free, online or in print, under a Creative Commons license.
Republish this article
This work is licensed under a Creative Commons Attribution-NoDerivatives 4.0 International License
Read Next

Guides Tipsheet Data Journalism GIJC23
No Coding Required: A Step-by-Step Guide to Scraping Websites With Data Miner
Knowing where to look for data — and accessing it via scraping data from websites — can be a powerful force multiplier for investigative journalists.

Resource Tipsheet
Basic Data Journalism Tips for Editors
At the NICAR22 conference in Atlanta, Georgia, journalism trainer MaryJo Webster offered a series of basic tips for editors who have little to no data analysis skills.

Data Journalism My Favorite Tools
My Favorite Tools: Venezuela’s Lisseth Boon on Design and Data Visualization
Since her arrival at Runrun.es, Lisseth Boon has conducted investigations on human rights violations, gold trafficking, illegal mining, and environmental crimes, many of them recognized with national and international awards. Her team has also worked with media platforms both inside and outside of Venezuela such as Consejo de Redacción and Connectas in Colombia, Convoca in Perú, and Mongabay. It has also participated in transnational collaborative projects such as the Panama Papers, Fincen Files, Swiss Connection, Lava Jato (Operation Car Wash), Vigila La Pandemia, and Tierra de Resistencia.
Case Studies News & Analysis
Round-Up of Notable Watchdog Reporting on the Israel-Hamas Conflict
To show how investigative journalism can still be done in such a perilous reporting environment, here is a selection of some of the best investigations that have been produced so far on the Gaza conflict.