Image: Screenshot, The New York Times
Data Journalism Top 10: A Year of War in Ukraine, Russian Casualties, Trans Identities, Unexpected NBA Performances
Read this article in

Step-By-Step Guide for Journalists on the Basics of Google Sheets

Tipsheet for Using Ocean Data in Your Investigations

No Coding Required: A Step-by-Step Guide to Scraping Websites With Data Miner

GIJC23 – The Future of Data Journalism: New Analytical Tools, Data Visualization, and AI
Last week, February 24 marked the one-year anniversary of Russia’s invasion into Ukraine. Data teams in media outlets across the world noted the fact by producing interactives and graphics tracking myriad aspects related to the war, from the changing landscape of occupied territories to the number of casualties, and from the extent of destruction and losses to the cryptocurrency support of the war.
Our weekly NodeXL and human curation of the most popular data journalism stories on Twitter also features a cross-border investigation into chemical pollution in Europe, a study on media coverage of trans identities in France, a Nigerian election data portal, an analysis of Malaysia’s budget, and an interactive game about Indonesia’s coal tycoons.
One Year of War in Ukraine
Texty, a Ukrainian data journalism agency, examined the data from a full year of war by mapping the ebb and flow of Russia’s invasion of Ukraine, charting estimated deaths of Russian troops, and visualizing the blackouts, frequency of strikes, losses of military equipment, and more. The team’s choice of using only black and white to present the data befits the somber information. Also worth a look: The Financial Times examined how long Russia could potentially keep fighting the war in Ukraine based on the factors of ammunition, finances, mobilization, and public support. Meanwhile, The Economist used FIRMS & Sentinel-1 satellite data to assess the extent of destruction in Ukraine.
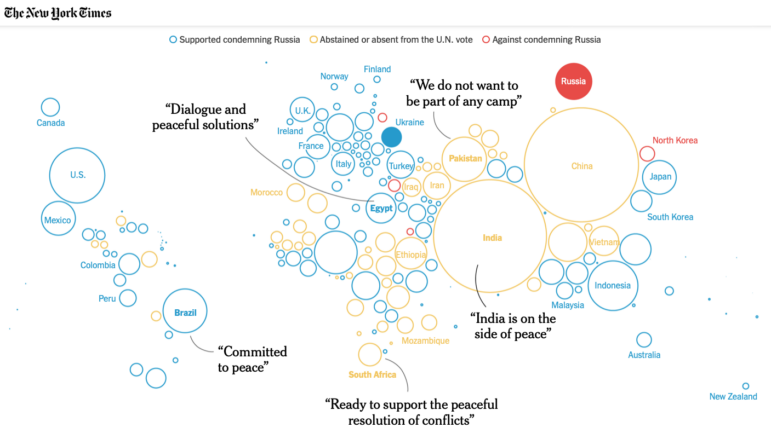
Failure to Isolate Russia
When Russia invaded Ukraine, it seemed as if the overwhelming opposition to war from 141 countries for a United Nations measure calling for withdrawal would isolate Russia from the world. The New York Times shows in this piece how that was a fallacy and Russia was able to work around sanctions and forge new relationships. Of the 47 countries that abstained from or missed that UN vote, many of those “neutral” nations have since helped Russia by providing crucial economic, military, or diplomatic support.
Air Raid Alerts
Since February 24, 2022, not a day has passed without a siren going off somewhere in Ukraine. A data visualization by El Pais, using information from the volunteer-run єТривога app — which sends push notifications to cell phones to warn people of threats in their area — mapped the frequency of air raid sirens in Ukrainian regions and cities since Russia’s invasion. For example, people in the Kharkiv, Donetsk, and Mykolaiv regions have spent more than 1,000 hours under siren alerts — with an average of five alarms per day in Donetsk.
Tracking Russian Casualties
Over the past year, Russian independent outlet Mediazona, working with BBC News’ Russian service and volunteers, has been collecting data and creating infographics about Russian military casualties — based on information that can be corroborated by public reports, social media posts by relatives, and local news. As of February 24, 2023, the verifiable casualty count stood at 15,136, with 1,043 casualties having occurred in the previous two weeks, although the real death toll is likely much higher. You can read the article in Russian and in English.
Cryptocurrency Support of Ukraine
Current Time TV, a Russian-language television channel based in Prague, examined the cryptocurrency donations channeled towards Ukraine’s humanitarian and military needs over the past year. It looked at the number and amount of digital currency transfers to Ukrainian organizations and the crypto wallets involved.
Forever Pollution in Europe
A months-long, cross-border investigation by Le Monde and 17 partners, called the Forever Pollution Project, revealed the extent of European contamination by “forever chemicals” — per- and polyfluoroalkyl substances (PFAS), a family of ultra-toxic, indestructible compounds that will linger for hundreds or thousands of years. (Products that use PFAS include non-stick pans, Gore-Tex, and semiconductors.) The project’s interactive map shows hotspots, known contamination areas, and PFAS industrial sites, among other information. Read the whole series and get the data here.
Media Coverage of Trans Identities
The AJL — a French association of lesbian, gay, bisexual, trans, and intersex journalists — analyzed articles in 21 online outlets to compile a study of how trans issues are covered in the French media. Of 434 articles, they found that half did not respectfully handle trans identities and a quarter were judged to be anti-trans. But journalist and AJL member Camille Regache notes that in the media overall there has been some progress in the vocabulary and depth of investigations involving trans people. Regache also adds that editorial inconsistencies in how trans identities are covered, even within the same publications, suggest that coverage is driven by individual opinions rather than a coherent editorial stance. Discover the study’s methodology here.
Tracking Nigerian Election Data
Nigeria just held its presidential election on February 25. Dataphyte, a media research and data analytics organization, set up a portal to act as a repository of election data in the country from the national to the subnational level. Besides providing analyses of election data, the portal also documents significant or suspicious electoral incidents including voter identification equipment malfunctions, bribery, and voting disruptions. Also don’t miss The Outlier’s data analysis of Nigeria’s voting population and its presidential candidates.
Analyzing Malaysia’s Budget
Malaysia re-released its 2023 budget last week as the previous parliament had prematurely dissolved before this year’s bill could be passed. Malaysiakini analyzed and presented the numbers in easy-to-digest charts in order to explain what the revised budget numbers meant. The team also created an interactive quiz for readers to input demographic details and obtain a personalized list of the benefits they would receive from the budget.
Greatest Unexpected NBA Performances
The Pudding used statistics and Game Score — an approximate measure of a player’s productivity in a single game — to reveal the best-ever unexpected NBA basketball performances, and just how exceptional these performances were when measured against the rest of a player’s career. The video essay shows footage of some of the most surprising NBA performances and explains the math underpinning the data, based on the biggest single-game score outliers. Download the data here.
Bonus: Indonesia’s Coal Tycoons
In February 2022, Indonesian reporting collective Project Multatuli published an interactive story exploring the many layers of the country’s coal oligarchy — and introducing readers to the 10 men who control the resource and preside over dirty energy enterprises. The project — which was a game in which readers, or players, answer questions about coal oligarchs’ businesses and networks — was recently awarded “Best Data Visualization” at the 2023 Indonesian Data Journalism Awards.
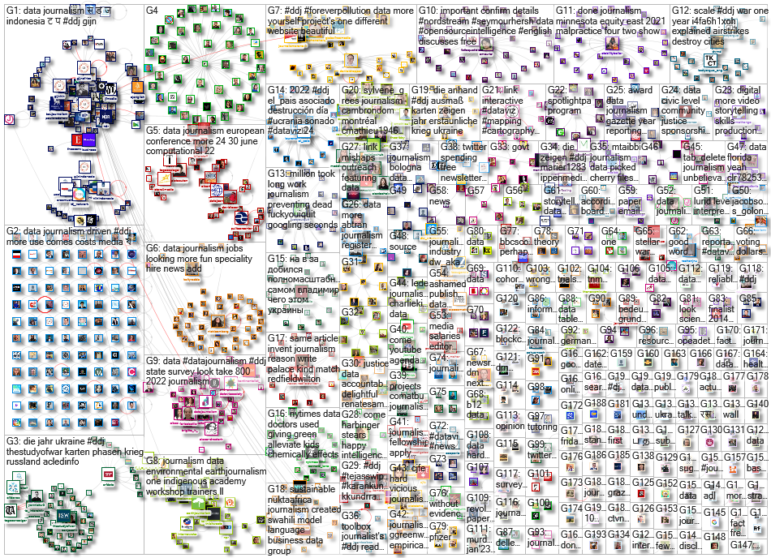
Thanks again to Marc Smith and Harald Meier of Connected Action for gathering the links and graphing them. GIJN’s Data Journalism Top 10 list is curated weekly.
 Alexa van Sickle is an associate editor at GIJN. She was previously a senior editor for the foreign correspondence magazine Roads and Kingdoms. She has also been an editor at the International Institute for Strategic Studies and a publisher at an international law non-profit in London. She lives in Vienna, Austria.
 Eunice Au is GIJN’s global team manager based in Budapest, Hungary. Previously, she was a Malaysia correspondent for Singapore’s The Straits Times, and a journalist at Malaysia’s New Straits Times. She has also written for The Sun, Malaysian Today, and Madam Chair.
For a look at NodeXL’s mapping on #ddj and data journalism on Twitter, check out this map.
Step-By-Step Guide for Journalists on the Basics of Google Sheets
Tipsheet for Using Ocean Data in Your Investigations
No Coding Required: A Step-by-Step Guide to Scraping Websites With Data Miner
GIJC23 – The Future of Data Journalism: New Analytical Tools, Data Visualization, and AI
Global Data Center Energy Use, US Strike on Iran School, Russia’s Security Service Leaks, Portugal’s Ancient Trees

One Name at a Time: How Die Zeit Built a Searchable Database of Nazi Party Members

Visualizing a Trillion Dollars, India’s Warming Cities, Russian Mercenaries at Sea, and World Cup Player Physiques

Rare Earth Rivalry, Falling Birth Rates, Violence in the Sahel, and 70 Years of Eurovision Lyrics

This work is licensed under a Creative Commons Attribution-NoDerivatives 4.0 International License
Republish our articles for free, online or in print, under a Creative Commons license.
Republish this article
This work is licensed under a Creative Commons Attribution-NoDerivatives 4.0 International License
Read Next
Data Journalism Top 10
Global Data Center Energy Use, US Strike on Iran School, Russia’s Security Service Leaks, Portugal’s Ancient Trees
This latest Top 10 in Data Journalism column also highlights rising drug-related deaths in Berlin, heatwave fatalities in Europe, and Hong Kong’s rapidly aging population.
Data Journalism
One Name at a Time: How Die Zeit Built a Searchable Database of Nazi Party Members
An online tool set up by the German newspaper Die Zeit, in cooperation with archives in Germany and in the United States, allows people to search several million Nazi Party membership cards.
Data Journalism Top 10
Visualizing a Trillion Dollars, India’s Warming Cities, Russian Mercenaries at Sea, and World Cup Player Physiques
Also highlighting how films portray Ukrainians, increasing tree cover in Spain, and how couples meet.
Data Journalism Top 10
Rare Earth Rivalry, Falling Birth Rates, Violence in the Sahel, and 70 Years of Eurovision Lyrics
Also highlighting China’s squid fishing fleet off Argentina, how redistricting is shaping America’s midterms, and why 2.1 billion people still lack safe drinking water.