Register for #GIJC25
November 20, 2025 • 09:00
-
day
days
-
hour
hours
-
min
mins
-
sec
secs

Accessibility Settings

color options

monochrome muted color dark

reading tools

isolation ruler

Language

English

2858 posts

Data Journalism

Data Journalism Top 10: Herd Immunity Calculator, Post-COVID Offices, Back-to-School Jitters

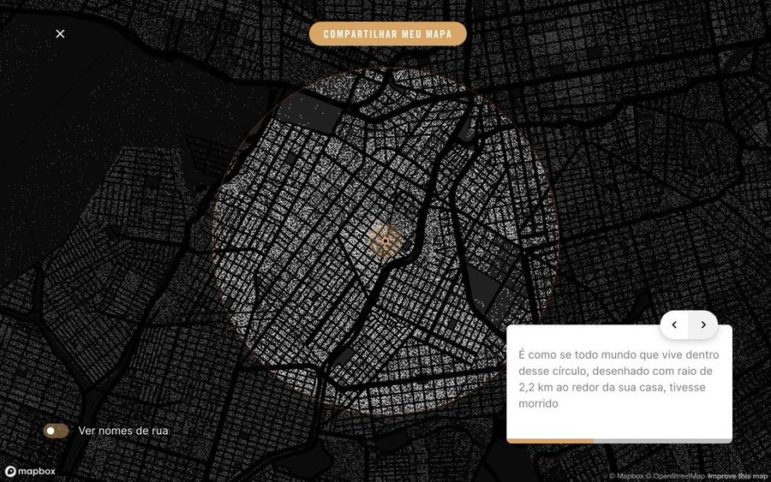
How many people need to get infected or die of the coronavirus before we reach a herd immunity threshold? Our NodeXL #ddj mapping from August 3 to 9 finds that The Washington Post created a herd immunity calculator to estimate this. Also in the Data Journalism Top 10 this week: BBC’s Visual and Data Journalism team illustrates the future of work environments post-COVID-19, The New York Times shares projections of the potential number of children who may carry the virus back to school in the fall according to county, and Oregon Public Broadcasting discovers a surprising reason for the low incidence of coronavirus transmission in bars and restaurants in the US state of Oregon. 

Reporting Tools & Tips

Use World Bank Records to Track COVID-19 Spending in Your Country

There is widespread concern that corruption will affect the use of international funds being rushed out in response to the COVID-19 pandemic. GIJN has created a guide to using World Bank documents online to track the use of the Bank’s projects in more than 100 countries.   

Data Journalism

Here’s Why Investigative Reporters Need to Know Knowledge Graphs

Across the data science community, knowledge graphs have become a growing phenomenon in recent years, driving many applications including virtual assistants like Siri and Alexa. Friedrich Lindenberg, from the Organized Crime and Corruption Reporting Project, writes about how its data platform Aleph makes use of knowledge graphs to help investigative reporters analyze and cross-reference data.

New GIJN Online Series Starts September 2020

Since the start of the pandemic, GIJN has produced more than 40 free webinars in 7 languages designed for journalists covering the COVID-19 crisis. Come September, GIJN will expand its online offerings on a range of new topics, with continued coverage of the pandemic.

Data Journalism

Data Journalism Top 10: Climate Migrants, COVID Testing Disparities, Outbreak Epicenters, Brazil’s Military

In the midst of the pandemic, some newsrooms haven’t forgotten about the issue of climate change. Our NodeXL #ddj mapping from July 20 to 26 found ProPublica partnering with The New York Times Magazine to examine climate migration and where climate refugees are moving to. On the COVID-19 front, FiveThirtyEight revealed the disparities in the availability of testing sites between Black and Hispanic neighborhoods and white areas, broadcaster RBB highlighted that the risk of coronavirus was more keenly felt by low-income earners, and the Google News Initiative and Agência Lupa communicated the impact of the coronavirus by visually putting readers at the epicenter of an outbreak.

News & Analysis

Collaborating to Identify COVID-19’s Victims in New York City

When a team of student journalists realized that thousands of New Yorkers had died due to COVID-19 but had been left out of the obituary pages, they teamed up to create Missing Them, an ambitious collaborative journalism project working to memorialize everyone that died due to COVID-19 in one of the hardest-hit cities in America.