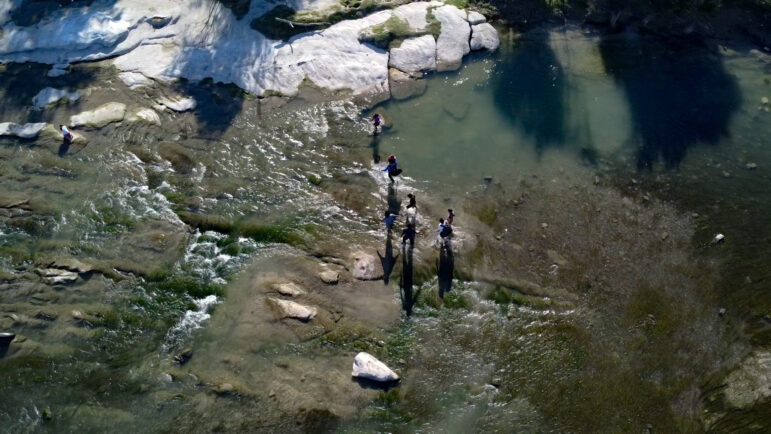
Migrants crossing the Río Grande/Rio Bravo. Image: Paola Reyes for El Universal. Republished with permission
Investigating How Many Migrants Lose their Lives Crossing the Rio Grande
Read this article in
For those hoping to cross from Mexico into the United States, the final hurdle is often the Rio Grande, also called the Rio Bravo. The river marks the border between Texas on one side, and four Mexican states on the other.
Crossing it has long been known to be dangerous. But what began as an occasional news story when a tragic drowning had occurred became a transnational investigative project when three newsrooms decided to dig into the data on deaths on both sides of the border.
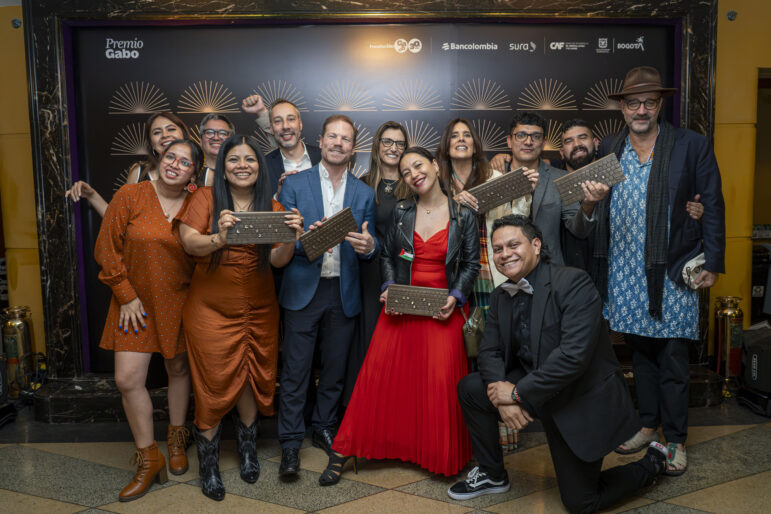
The resulting investigation, which was published by Mexico’s El Universal, the investigative outlet Lighthouse Reports, and The Washington Post, went on to win the 2025 Gabo Award in the coverage category, where judges praised its “investigative rigor, its innovative approach, and its ability to question power structures with evidence and sensitivity.”
The project started with an idea to examine how many women and children were dying trying to cross this stretch of water. Reporters had observed changes in migration dynamics since the pandemic: now entire families were leaving their countries to reach the United States. And while there are dangers the length of the journey, crossing this river – the final stage – was proving for many to be a matter of life or death.
GIJN interviewed journalists Miriam Ramírez and Daniela Guazo from El Universal, along with Melissa del Bosque of Lighthouse Reports to learn about the work behind the investigation. They detailed how dogged document gathering and extensive data analysis allowed them to reveal a figure for migrant drownings that was “significantly higher” than the previous best-known estimate, and shared their experiences of organizing a cross-border collaboration, collating data, and being true to the stories of the people they featured.
Defining a Methodology
In large-scale collaborative investigations like this, building a methodology before starting research is key to saving time and focusing on what you want to find out or prove. Melissa del Bosque, who is the investigations editor at Lighthouse Reports, said the team understood early on the importance of establishing a work scheme.
The methodology that served as the basis for the investigation was developed with the support of experts, activists, journalists, and academics such as Professor Stephanie Leutert, an expert on migration at the University of Texas at Austin.
The Rio Grande runs along the border states of Chihuahua, Coahuila, Nuevo León, and Tamaulipas on the Mexican side, and the state of Texas on the US side.
One of the team’s key early discoveries was that there was no single official record of deaths in the river – while some deaths were recorded in the US, others were documented by Mexico.
To counter that problem, they designed a work process from data collection to analysis, that created a roster of sources among authorities at the local, state, and national levels, and that established standards and processes for contacting identified sources. Lastly they made sure that they had a standardized data entry and verification process, which covered everything from processing information to identifying and handling duplicate cases.
Del Bosque said that the methodology – and the work plan that was based on it – meant that collaboration was smoother and brought clarity about what the investigation sought to achieve. The methodology was also made public, so that other journalists could replicate similar work.
Handling Gaps in the Data
Expecting there to be a number of government agencies or public organizations that would hold the information they needed for the investigation, journalist Miriam Ramírez and her colleagues created a list: identifying 165 sources to whom they made requests for information.
While they initially hoped to use 2012 as a starting point, obstacles in accessing the data forced them to refocus their research on the period from 2017 to 2024.

Miriam Ramírez who works for El Universal. Image: Courtesy of the reporter
From the beginning, they realized that there was going to be an issue working across borders. While US authorities provided files with geographic coordinates, age, name, date of birth, nationality, and the place where the drowning occurred, the situation was more complex on the Mexican side. The Ministry of Foreign Affairs and the National Migration Institute provided annual statistical data that was “very poorly disaggregated, making it difficult to analyze the information,” Ramírez explains.
“We had to abandon our initial hypothesis regarding the drowning of children because we faced deficiencies in the records… Few authorities provided information from previous years, and we only obtained useful data from 52 of the 165 authorities identified,” she says.
The team submitted more than 200 requests to access the information. When they hit a wall, they sought other avenues: they modified their questions, searched public databases, and made calls to speak directly with the agencies, utilizing all available resources to get the data they needed.
During the data collection process, del Bosque noted how both countries lacked information on migrant deaths by drowning. Even other media, she adds, showed little interest in reporting on the issue, as if there were no stories to tell.
Building Your Own Databases and Standardizing Records
Faced with data gaps and the disparity of records between countries, the Lighthouse Reports team took on the challenge of standardizing records and analyzing the data. The methodology they used details the process to avoid duplication of cases between those provided by the Mexican municipalities and prosecutors’ offices and those from US Customs and Border Protection.
Through this work, the team was able to find:
- That there had been a higher number of drowning deaths than previously reported. The team identified that at least 1,107 people drowned while crossing the Rio Grande between 2017 and 2023.
- That the official data in both the United States and Mexico was incomplete, leaving hundreds of deaths unaccounted for.
- Deaths peaked in 2021-2022, the years in which Texas attempted to seal its border with Mexico in an initiative called Operation Lone Star.
- New data on the demographics of those migrants drowning in the river. According to the report, in 2023 about one in five drowning victims was a woman and one in 10 was a child.
“What we did was to analyze the periods when these deaths began to increase, the start of Operation Lone Star, and the reinforcement of the National Guard deployment, and that’s where we find these patterns, a link between militarized immigration policies, and the increase in deaths,” Ramírez notes. While her team could not establish a conclusive causal relationship between the border build-up and the spike in drownings, expert interviews and migrant testimony pointed to a clear correlation.
Their methodology also addressed how to discard duplicate data. This allowed for the consolidation of a single database, enabled them to generate an analysis of the information, and then share the results. Ultimately the figures shed light on one of the teams’ hypotheses: Operation Lone Star had had an influence on the number of drownings being reported.
The Washington Post team conducted the forensic analysis and reconstructed the increase in Lone Star’s infrastructure using satellite imagery. Contributions from the other journalistic teams complemented this work.
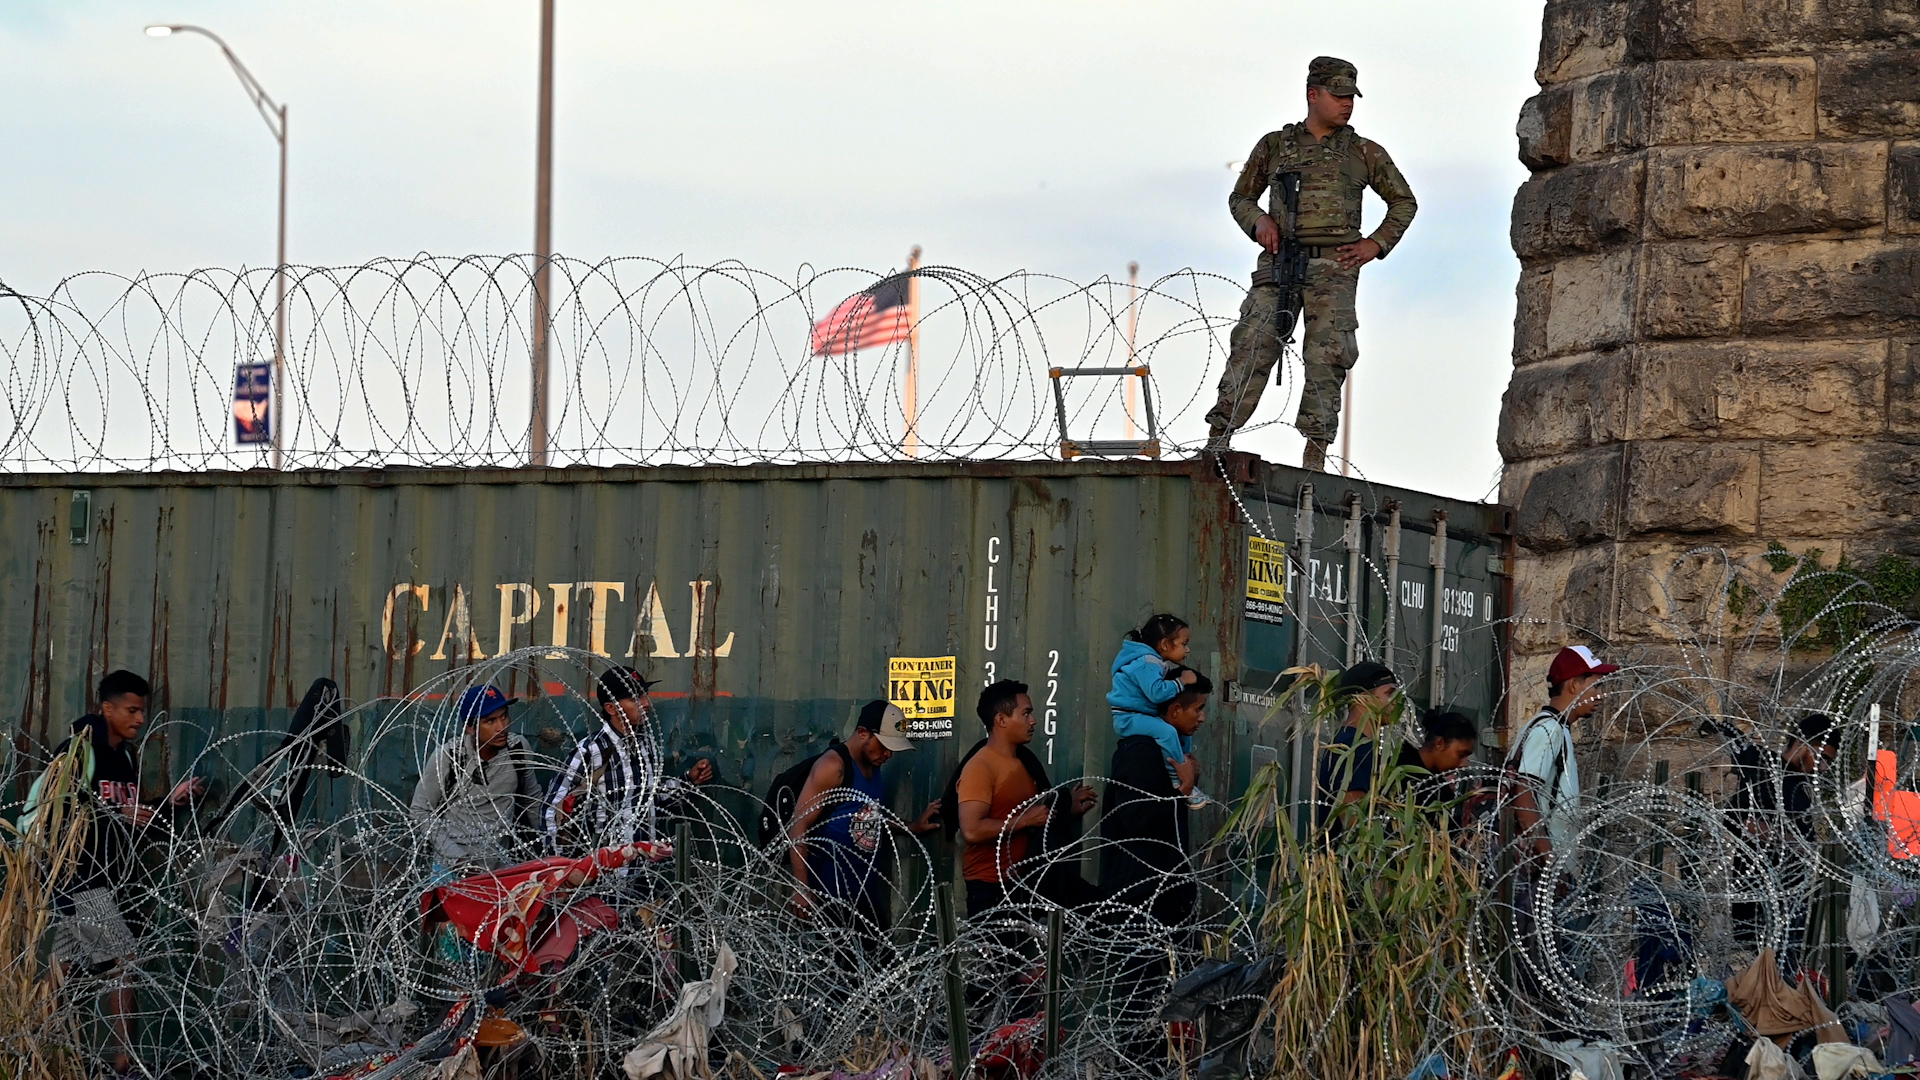
Reporters documented the build-up of infrastructure on the US-Mexico border, such as the use of barbed wire and shipping containers at certain points. Image: Justin Hamel/ Lighthouse Reports. Republished with permission
Visualization: What’s the Most Important Thing to Report?
For this project, up to three meetings per week – which took place in Spanish and English – were necessary, ranging from editorial meetings where findings were shared, to huddles with the team of reporters to follow up on hypotheses, to meetings to review the visualizations that would be generated.
“Data analysis supports the editorial teams’ hypotheses. It’s not about looking for new angles; it’s about supporting what already exists. After that comes the question: how do we visualize this?” explains Guazo.
The data team proposed up to six sketches so the team could discuss how they would illustrate the data showing fatalities, the presence of the National Guard, and buildup of the Lone Star infrastructure.
Choosing the right visualization for data is always a challenge, which is why Guazo recommends being clear about what you want to show and answering the questions: What is most important in the story? What do you want to convey to the reader?
The research required constant fact-checking to avoid errors in data analysis, and with new data added periodically, previous readings had to be modified.
Don’t Let the Data Overshadow the Story
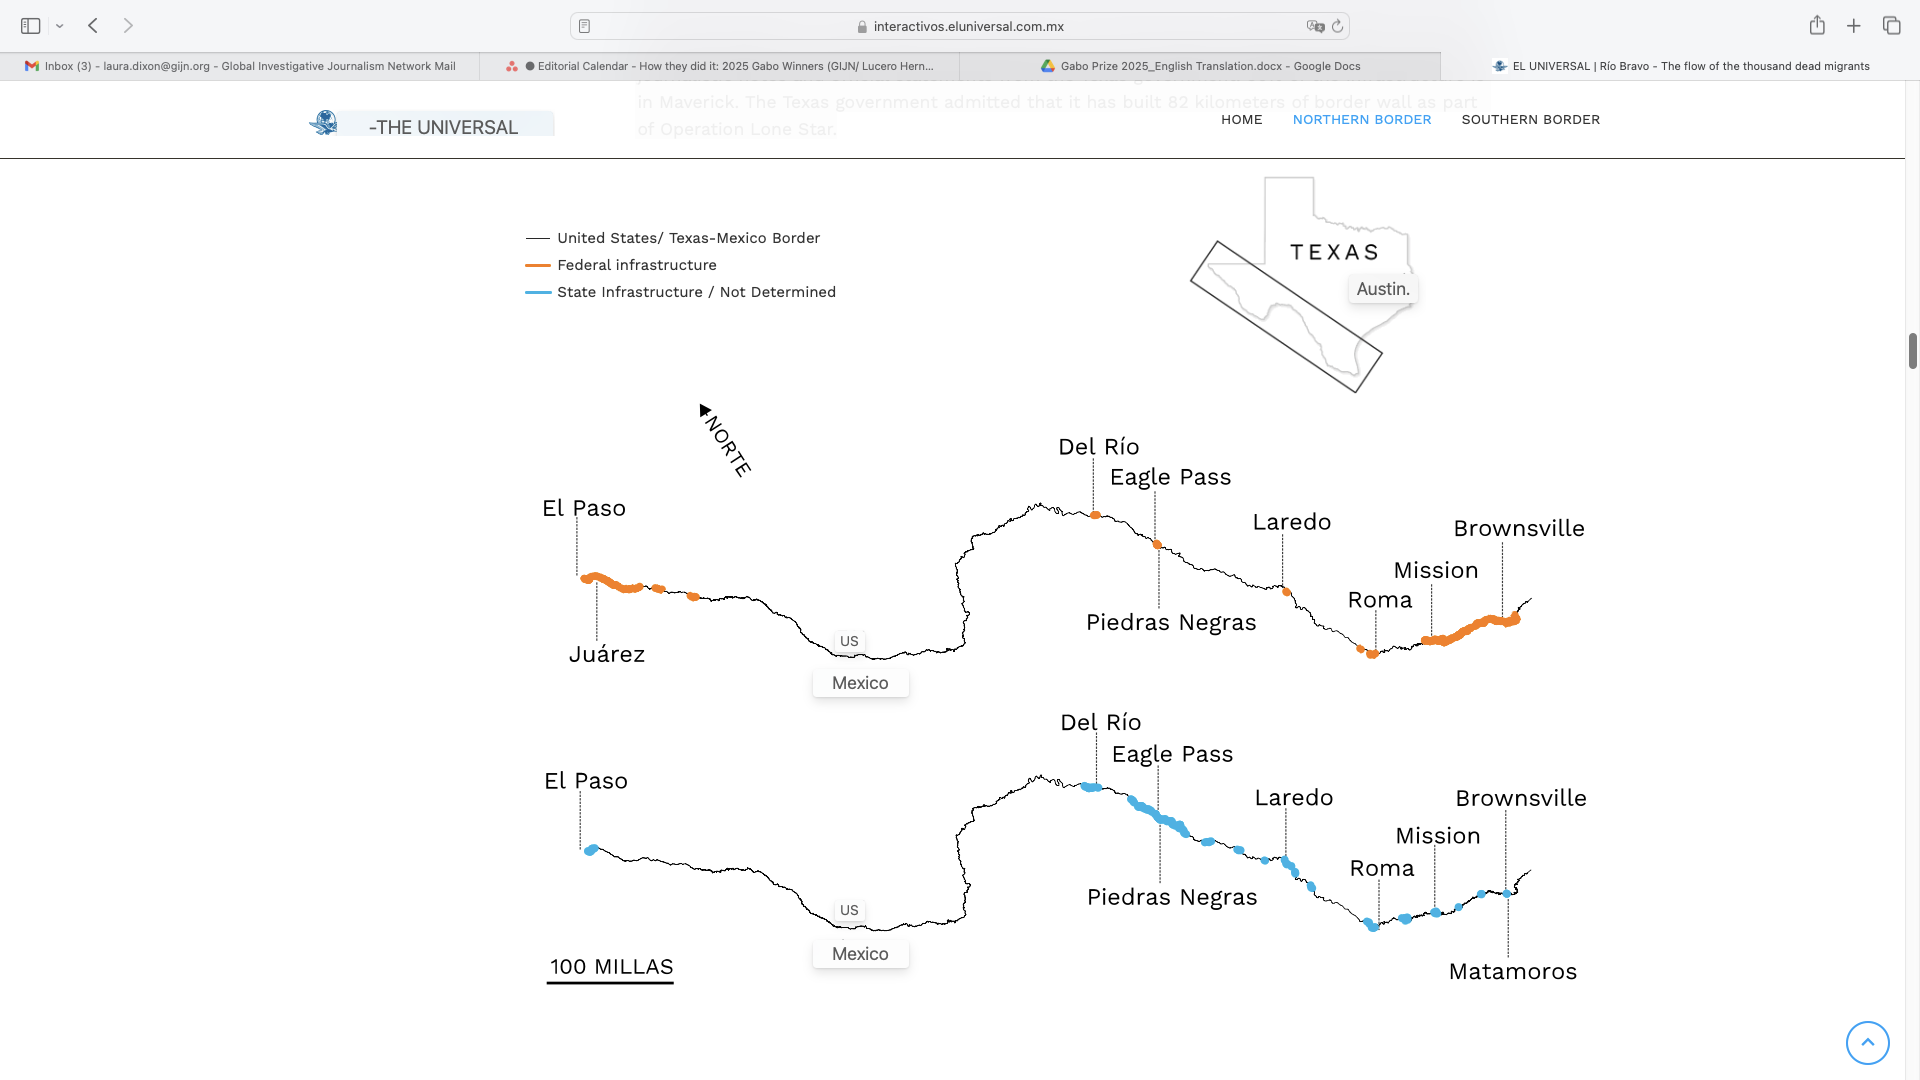
Reporters mapped out the changing infrastructure at key points along the Texas border with Mexico. Image: Screenshot of a map created by The Washington Post and Lighthouse Reports
The project lasted 10 months, but alongside the data element stood an editorial prerogative: Above all, the life stories of the people they were writing about had to prevail. Together, they reported on stories of people with destroyed families and broken dreams, migrants caught in a struggle to improve their quality of life. Among the stories of loss they recounted is one of a mother who lost her toddler and newborn baby while trying to cross.
That subject matter made the fieldwork even more challenging than the technical data questions, says Ramírez.
“I had been processing death figures, I knew there were drownings, but once I got to the field and saw the children, women with babies, pregnant women, it really impacted me,” she adds.
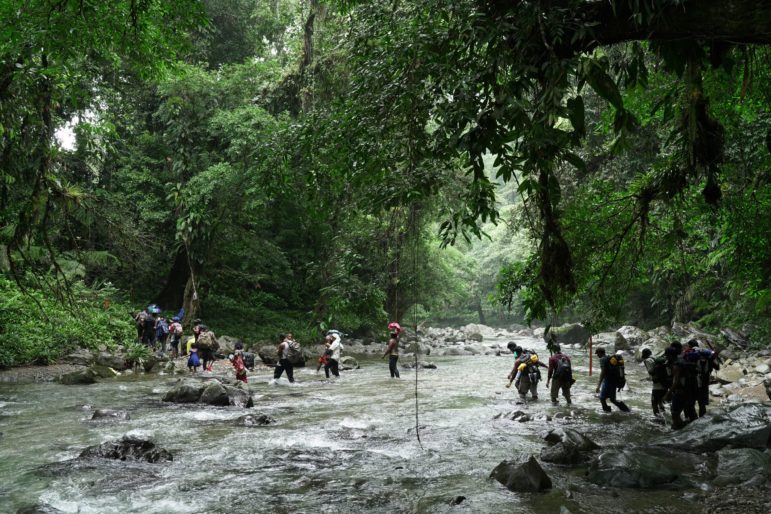
The situation at the border is also complicated by a serious organized crime dynamic, with migrants often facing kidnappings, extortion, disappearances, and homicides on their journey through Mexico.
From del Bosque’s perspective, there are not enough journalists interested in covering stories about migration due to political pressure or threats related to organized crime gangs, who are often involved in transporting migrants.
“Many media outlets don’t want to write about these issues because they say: ‘We’ve already written stories, there’s nothing new,’” she says. “Eight years ago there was more interest, unfortunately now migrant deaths have become normalized, and there’s also a crisis in journalism and few journalists focus on migration. We need to create new ways of looking at this issue.”
 Lucero Hernández García is a freelance journalist and digital consultant from Mexico, and a GIJN collaborator. She has a master’s degree in communication and digital media, with a specialty in multimedia production. She runs workshops and teaches data, visualization, digital tools, and online journalism to university students. Her work has been published by IJNet, and she has received scholarships from Cosecha Roja, Sembramedia, and the Thomson Reuters Foundation.

Introduction to Investigative Journalism

Investigating Human Trafficking, an Evil Hidden in Plain Sight

How Quinto Elemento Trains Mexico’s New Generation of Muckrakers
How They Did It: Covering One of the World’s Most Dangerous Border Crossings

The Power of Collaboration: El CLIP and the Plan to Transform Latin America’s Investigative Ecosystem
Festival Gabo 2025: Journalism as a ‘Light of Hope’ in an Increasingly Challenging Era for Latin America
How They Did It: Investigating the Pylos Shipwreck

Tracking the Exploitation of Illegal Gold, Human Trafficking, and Government Corruption: 2024’s Best Investigative Stories in Spanish

This work is licensed under a Creative Commons Attribution-NoDerivatives 4.0 International License
Republish our articles for free, online or in print, under a Creative Commons license.
Republish this article
This work is licensed under a Creative Commons Attribution-NoDerivatives 4.0 International License
Read Next
LATAM Focus Member Profiles News & Analysis
The Power of Collaboration: El CLIP and the Plan to Transform Latin America’s Investigative Ecosystem
CLIP was founded by three leading journalists who shared the conviction that to mirror the transnational challenges journalists face in Latin America, the stories had to be cross-border too.
News & Analysis
Festival Gabo 2025: Journalism as a ‘Light of Hope’ in an Increasingly Challenging Era for Latin America
The 13th edition of the Gabo Festival highlighted some of the most urgent challenges facing journalism today, particularly in Latin America.
How They Did It
How They Did It: Investigating the Pylos Shipwreck
In June 2023, a small fishing trawler carrying hundreds of migrants sank off the coast of Pylos, Greece — one of the deadliest migrant shipwrecks in recent years.
Editor's Picks News & Analysis
Tracking the Exploitation of Illegal Gold, Human Trafficking, and Government Corruption: 2024’s Best Investigative Stories in Spanish
A tour of the year’s best investigations from across Latin America and Spain, where journalists are uncovering stories that impact their communities.