Image: Shutterstock
4 Things Data Journalists Need to Know about Standard Deviation
Read this article in

Step-By-Step Guide for Journalists on the Basics of Google Sheets

Tipsheet for Using Ocean Data in Your Investigations

No Coding Required: A Step-by-Step Guide to Scraping Websites With Data Miner

GIJC23 – The Future of Data Journalism: New Analytical Tools, Data Visualization, and AI
If you’re a journalist who reads academic research, you’ve likely seen the term “standard deviation” many times. If you’re not sure what it means or how to explain it to audiences, keep reading, because we’re going to break it down for you.
Here are four key things you need to know.
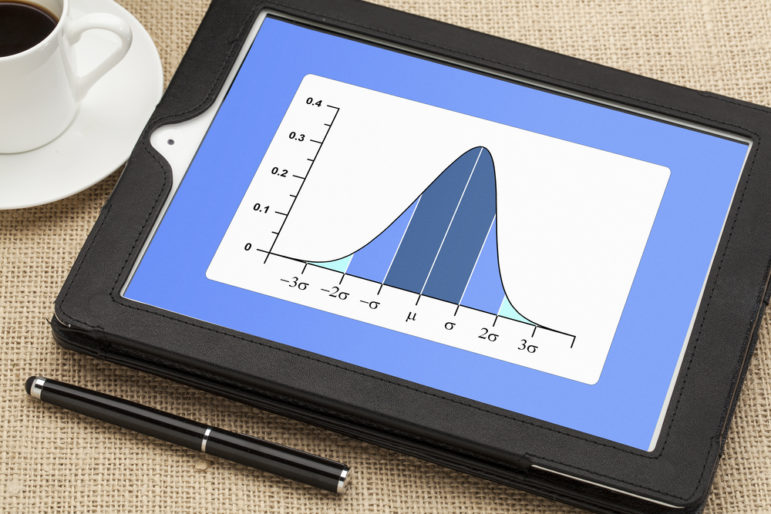
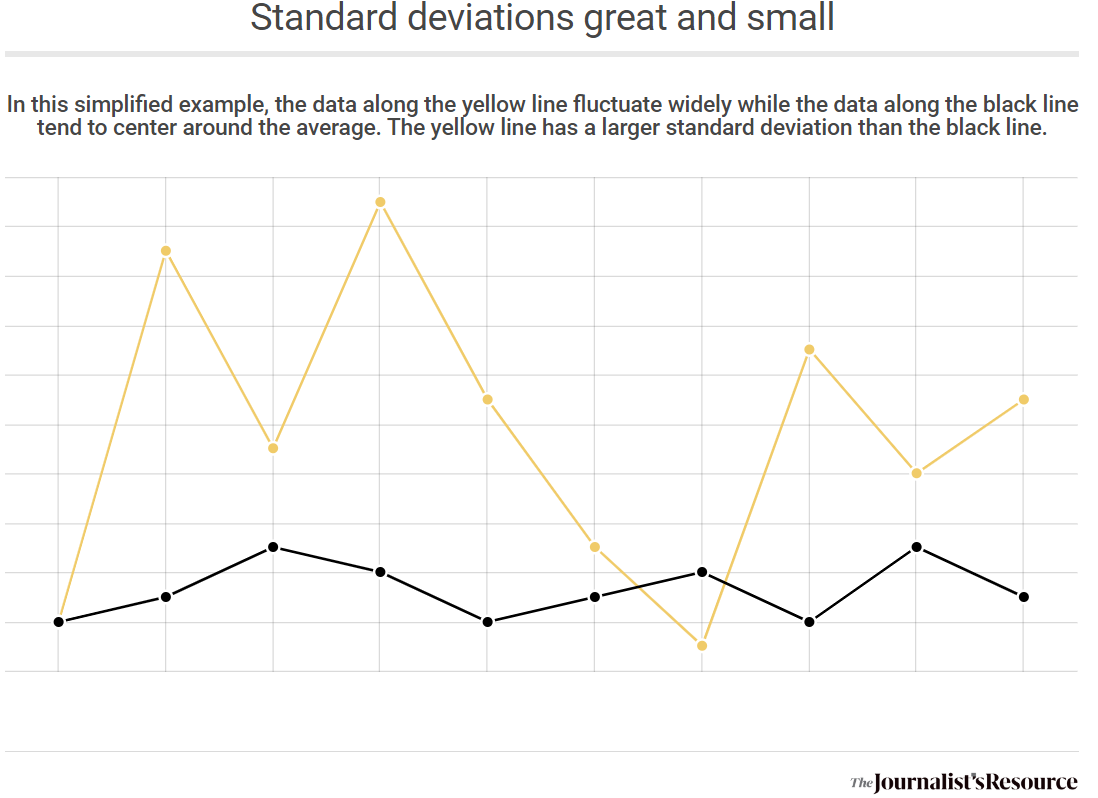
1. The standard deviation of a dataset is a number that indicates how much variation there is within the data.
When researchers analyze quantitative data such as birth rates, temperature readings, and student test scores, they typically calculate the standard deviation of the data to gauge how close or far apart the data is. A higher standard deviation means the data is more spread out. The lower the standard deviation, the more closely data cluster around the average value of the data.
Deborah J. Rumsey, a statistics professor at the Ohio State University, points out in her book Statistics for Dummies that the measure provides critical context.
“Without it, you’re getting only part of the story about the data,” she wrote. “Statisticians like to tell the story about the man who had one foot in a bucket of ice water and the other foot in a bucket of boiling water. He said, on average, he felt just great! But think about the variability in the two temperatures for each of his feet. Closer to home, the average house price, for example, tells you nothing about the range of house prices you may encounter when house-hunting. The average salary may not fully represent what’s really going on in your company, if the salaries are extremely spread out.”
2. Scientists can use standard deviation to make predictions, investigate trends, and answer other key research questions.
The standard deviation of a dataset plays a limited role in many academic studies. Scientists might only note standard deviation values in a table or list, or mention them within the body of an academic article.
Sometimes, however, researchers rely heavily on the measure to help them answer questions central to their studies. For example:
- Researchers can make predictions about the weather, voter behavior, tax revenue, healthcare usage, and a host of other things based partly on the standard deviation of data gathered over time.
- Equities researchers typically use the standard deviation of stock prices to measure market volatility, with a high standard deviation indicating high volatility.
- Researchers examining student test scores can use the standard deviation to determine whether most students perform at or close to the average, or whether test scores are all over the place. The measure also allows researchers to estimate the proportion of students who need more help mastering the material.
Here’s a brief explanation of how to calculate standard deviation.
3. In some studies, scientists report their findings in terms of standard deviations instead of a unit of measurement, such as inches or pounds.
When datasets have data points with different units, scientists often need to standardize, or rescale, the data before they can draw comparisons and look for relationships. For instance, scientists might want to examine the relationship between orange juice consumption, measured in ounces [or grams], and flu vaccination rates, measured as the number of vaccines administered each month per 100,000 residents.
The process of standardizing data includes dividing each numerical data point by the standard deviation of the dataset. Doing this changes the units of measurement. Instead of expressing findings using common units such as ounces, inches, and pounds — or kilograms — they must be reported in terms of standard deviations.
Hypothetically, scientists looking at orange juice consumption and flu vaccination rates could conclude that a one standard deviation increase in juice consumption is associated with a one standard deviation reduction in vaccination rates.
While standardizing datasets can make them easier for researchers to work with, Brian Healy, an associate professor of neurology at Harvard Medical School, notes many people might have difficulty understanding the results. He urges journalists to read these papers closely.
“The problem is, unless you look really closely in the paper, you’ll have no idea what a one standard deviation means,” says Healy, who’s also the lead biostatistician for the Partners Multiple Sclerosis Center at Brigham and Women’s Hospital in Boston.
“Do understand the units that results are being shown in,” he adds. “If there is a number reported, you want to make sure you understand how to interpret the number, and you can’t understand how to interpret the number without knowing the units.”
4. Scientists can use standard deviation to help confirm whether a data point they consider an outlier actually is an outlier.
Outliers are extremely high or low values that can complicate statistical analyses, and skew results. Many researchers will remove or alter outliers caused by error — for example, an error in collecting or entering data.
When you look at a graph of all the data in a dataset, some data points appear to be outliers because they differ so much from the others. Since the standard deviation of a dataset takes into account how far away individual values are from the average, scientists often use it to gauge whether an unusual data point is an outlier. This method works well for datasets that follow the pattern of a symmetrical, bell-shaped curve in which the majority of data converge near the center of the bell, where the average value is located.
After calculating the standard deviation for that dataset, it’s easy to spot outliers. A general rule of thumb for data that follows a bell-shaped curve is that approximately 99.7% of the data will be within three standard deviations of the average. Data outside this boundary are usually deemed outliers.
Although the standard deviation of a dataset is affected by outliers, journalists should not assume a large standard deviation indicates data quality problems. As Rumsey writes in Statistics for Dummies, “a large standard deviation isn’t necessarily a bad thing; it just reflects a large amount of variation in the group that is being studied.”
This post was originally published by The Journalist’s Resource, and is reprinted here via its Creative Commons license. The Journalist’s Resource would like to thank Troy Quast, a professor of health economics at the University of South Florida’s College of Public Health, and Brian Healy, an associate professor of neurology at Harvard Medical School, for their help creating this tipsheet.
Additional Resources
5 Things Journalists Need to Know About Statistical Significance
New Data Tools and Tips for Investigating Climate Change
GIJN Resource Center: Data Journalism
 Denise-Marie Ordway is managing editor of The Journalist’s Resource, which she joined in 2015 after working for newspapers and radio stations in the US and Central America. Her work has appeared in USA TODAY, The New York Times, and The Washington Post. She was a 2014-15 Harvard Nieman Fellow.
Step-By-Step Guide for Journalists on the Basics of Google Sheets
Tipsheet for Using Ocean Data in Your Investigations
No Coding Required: A Step-by-Step Guide to Scraping Websites With Data Miner
GIJC23 – The Future of Data Journalism: New Analytical Tools, Data Visualization, and AI

Turning the Threat to a Distant Glacier into a Local Story Through Data Visualization

One Name at a Time: How Die Zeit Built a Searchable Database of Nazi Party Members

How The Washington Post Combined Data and Human Stories to Cover Hurricane Helene’s Aftermath

Mexico Scrapped Its Transparency Agency — Journalists Are Still Investigating Corruption

This work is licensed under a Creative Commons Attribution-NoDerivatives 4.0 International License
Republish our articles for free, online or in print, under a Creative Commons license.
Republish this article
This work is licensed under a Creative Commons Attribution-NoDerivatives 4.0 International License
Read Next
Climate Data Journalism
Turning the Threat to a Distant Glacier into a Local Story Through Data Visualization
New York Times climate and environmental graphics reporter Mira Rojanasakul discusses how her team visualized the sea level rise threat from the melting Thwaites Glacier in Antarctica.
Data Journalism
One Name at a Time: How Die Zeit Built a Searchable Database of Nazi Party Members
An online tool set up by the German newspaper Die Zeit, in cooperation with archives in Germany and in the United States, allows people to search several million Nazi Party membership cards.
Data Journalism
How The Washington Post Combined Data and Human Stories to Cover Hurricane Helene’s Aftermath
From Storybench, Washington Post climate reporter Brady Dennis is interviewed about his immersive story on Hurricane Helene and the importance of combining data and human experience.
Data Journalism
Mexico Scrapped Its Transparency Agency — Journalists Are Still Investigating Corruption
A year after Mexico dissolved the autonomous body that oversaw government transparency, journalists are still finding ways to access public documents and conduct data-based investigations.