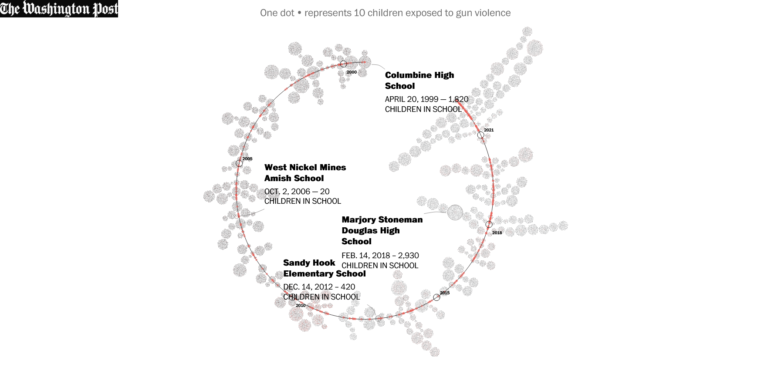
In the midst of the pandemic, some newsrooms haven’t forgotten about the issue of climate change. Our NodeXL #ddj mapping from July 20 to 26 found ProPublica partnering with The New York Times Magazine to examine climate migration and where climate refugees are moving to. On the COVID-19 front, FiveThirtyEight revealed the disparities in the availability of testing sites between Black and Hispanic neighborhoods and white areas, broadcaster RBB highlighted that the risk of coronavirus was more keenly felt by low-income earners, and the Google News Initiative and Agência Lupa communicated the impact of the coronavirus by visually putting readers at the epicenter of an outbreak.
Crowdfunding has become very popular in the Czech Republic, where it is often used to help launch independent media outlets or to get money to finance individual projects and cover specific topics.
GIJN asked investigative journalists around the world to look ahead at what’s in store for 2020. Here are the trends, key forces, and challenges they expect will affect investigative and data journalism in the coming year, as well as the new skills and approaches we should be thinking about.
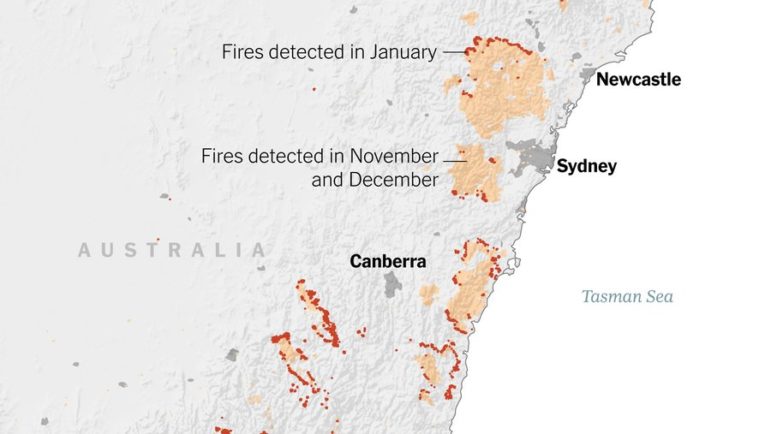
What’s the global data journalism community tweeting about this week? Our NodeXL #ddj mapping from December 30, 2019 to January 5, 2020 finds The New York Times examining Australia’s brutal fire season, the launch of The Sigma Awards to honor outstanding data journalism, Der Tagesspiegel analyzing the major changes across the globe in the past decade, and inspiring best-of data visualization lists by Nathan Yau, Pew Research Center, ZEIT ONLINE, the Los Angeles Times and the Financial Times.
Throughout this year, we’ve brought you weekly “snapshots” of the Twitter conversation surrounding data journalism. But this week, we look at what the global data journalism community tweeted about the most during all of 2019. Below you’ll find links to stories from Brazil, Germany, Switzerland, the UK, the US, and elsewhere.
What’s the global data journalism community tweeting about this week? Our NodeXL #ddj mapping from November 25 to December 1 finds The New York Times profiling Bellingcat and its use of OSINT techniques; the International Consortium of Investigative Journalists and Stanford University collaborating to employ artificial intelligence to solve a journalistic problem; and the Science Communication Lab creating a beautiful interactive scientific poster to explore the world’s oceans.
What’s the global data journalism community tweeting about this week? Our NodeXL #ddj mapping from October 7 to 13 finds The New York Times tackling the topic of auto emissions as a significant climate problem, The Washington Post mapping the colors of America’s fall foliage across the nation, St. Louis Post-Dispatch sharing its newsroom process in data transparency, and Nicholas Strayer offering a tutorial to build your own cool resume using R.
The Global Investigative Journalism Network and the Native American Journalists Association have created a resource to help Indigenous investigative journalists. This unique guide is designed to encourage Indigenous journalists worldwide and to empower them with tips, tools, and sources for information.
From the tropics to the Arctic, Indigenous peoples are on the front lines of the climate crisis. Investigative reporting is critical to tell their stories, delve into the causes and effects of global warming, and examine mitigation strategies. Indigenous communities worldwide are witnessing the impacts of warmer temperatures. They are also part of the solution.“Western scientific evidence is now saying what our Indigenous peoples have been expressing for a long time: Life as we know it is in danger,” said Tom Goldtooth, executive director of the US-based Indigenous Environmental Network (IEN) and an enrolled member of the Navajo Nation, in a 2019 Truthout article. Indigenous communities worldwide are witnessing the impacts of warmer temperatures.
What’s the global data journalism community tweeting about this week? Our NodeXL #ddj mapping from July 29 to August 4 finds a number of articles related to the climate crisis, including the BBC’s piece on tree planting and its interactive tool on temperatures across the world, as well as Alberto Cairo’s blog post on misleading charts created by climate deniers. We also found useful tips and tools: a data GIF maker by Google News Initiative, Datajournalism.com’s strategies for teaching data journalism, and Paul Bradshaw’s tutorial on how to extract numeric data from phrases.
INVESTIGATIVE RESOURCES
IN YOUR INBOX
Our fortnightly bulletin brings you the latest from GIJN, useful tips, tools and the best investigative stories around the world.