
GIJN’s Data Journalism Top 10: German Heat, Austrian Arms, Quebec School Fees and Salvadoran Kidney Disease
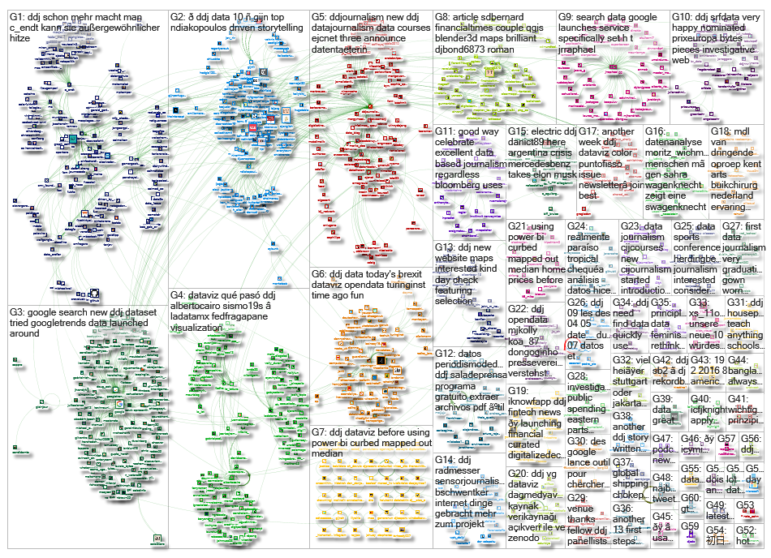
What’s the global data journalism community tweeting about this week? Our NodeXL #ddj mapping from September 3 to 9 finds @FiveThirtyEight attacked by the green-eyed monster with their equivalent of Bloomberg’s “Jealousy List,” @daswasfehlt breaks down Austria’s arms exports, @GoogleAI announces the beta launch of Google Datasets Search, and @SZ documents how climate change is wreaking havoc on temperatures in Germany (while boosting ice-cream sales).
Damn, Wish We’d Done That
FiveThirtyEight is so jealous of Bloomberg’s year-end “Jealousy List” that they’ve come up with their own monthly feature — “Damn, We Wish We’d Done These 5 Stories This Month.” Great for discovering excellent stories to be envious of and aspire to do better.
How Austria Arms the World
Austria’s weapon manufactuers exported arms, ammunition, vehicles and more to 164 countries between 2004 and 2016. Glock pistols for the FBI, vehicles to Algeria, tanks to Kuwait — Addendum breaks down where Austrian companies supply weapons. (In German)
Discover Datasets on Google
Google’s Dataset Search (beta), launched last week, continues to generate buzz. Similar to how Google Scholar works, Dataset Search lets you find datasets wherever they’re hosted, whether it’s a publisher’s site, a digital library or an author’s personal web page. Dataset providers have to follow some guidelines to allow Dataset Search to index their data and make it discoverable.
Hot in Germany
The 2018 season was so hot and dry that it begs the question: is this just normal weather or climate change? Suddeutsche Zeitung starts their piece strong with striking images showing missing lakes, forests and crops due to the hot weather, then maps the difference in this year’s summer temperatures compared to historical temperatures and peppers in anecdotes of people affected by the heat, including an ice-cream seller enjoying brisk sales. (In German)
Quebec’s Rising University Fees
Radio-Canada obtained financial databases from all Quebec universities, with information on incomes and expenditures over the past 20 years. They analyzed the data to pinpoint the reasons for the rise in university fees. (In French)
Kidney Disease Epidemic in El Salvador
Renal failure is one of the main causes of hospital deaths in El Salvador. ElSalvador.com discusses the stigma surrounding kidney disease and dialysis, which has led to a fear of being diagnosed with kidney disease and reluctance to get treated. (In Spanish)
Cairo on Dataviz
University of Miami professor Alberto Cairo teaches his students that, in order to understand visualization well, they need to be able to explain it to others. Here he features six pieces from his students.
https://twitter.com/albertocairo/status/1036601729108852737
Cairo on Interrogating Data
“If you know how to analyze, interrogate and interview data you will get stories, but if you do not have that capacity, the data will deceive you,” Alberto Cairo told Susana Pérez-Soler in a recent interview about the need for journalists to understand cognitive biases, and the data visualization project he is developing with Google News Lab. (In Spanish)
Extracting Data from PDFs
Tabula is a free tool for extracting data from PDF files into CSV and Excel files. Consejo de Redacción prepared a short tutorial on how to use Tabula to extract the data you need. (In Spanish)
#InfoVis2018 Summit
Catch Juan Velasco from 5W Infographic among those (Erika Espinosa of Deftly Creative, Lazaro Gamio from Axios, Angel García from Nuestro Diario, Antonio Farach from the Times of Oman, and Lauren Tierney from The Washington Post) at the second Infovis International Summit of Visual Communication in Mexico City on November 8 and 9.
Thanks, once again, to Marc Smith of Connected Action for gathering the links and graphing them.
 Eunice Au is GIJN’s program coordinator. Previously, she was a Malaysia correspondent for Singapore’s The Straits Times, and a journalist at the New Straits Times. She has also written for The Sun, Malaysian Today and Madam Chair.
For a look at Marc Smith’s mapping on #ddj on Twitter, check out this map.

GIJC23 – When the Data Aren’t There: Building Your Own Datasets

Basic Data Journalism Tips for Editors

My Favorite Tools: Venezuela’s Lisseth Boon on Design and Data Visualization

Document of the Day: Visual Vocabulary

From Data to Storytelling: Concept and Design Tips from the Financial Times’ John Burn-Murdoch

Data Don’ts: Expert Tips to Avoid Misleading Audiences With Numbers

How The Pudding Used Data Visualizations to Recontextualize the Story of Climate Change

How Data Journalism Is Changing the Face of Africa

This work is licensed under a Creative Commons Attribution-NoDerivatives 4.0 International License
Republish our articles for free, online or in print, under a Creative Commons license.
Republish this article
This work is licensed under a Creative Commons Attribution-NoDerivatives 4.0 International License
Read Next
Data Journalism
From Data to Storytelling: Concept and Design Tips from the Financial Times’ John Burn-Murdoch
The chief data reporter for the Financial Times discusses how he considers the use of text, color, and annotation to aid visual storytelling through charts and graphics.
Data Journalism
Data Don’ts: Expert Tips to Avoid Misleading Audiences With Numbers
At a NICAR 2025 panel, data journalism experts discussed nuanced number errors that watchdog reporters often make that can confuse readers and disrupt story angles.
Climate Data Journalism
How The Pudding Used Data Visualizations to Recontextualize the Story of Climate Change
What does climate change feel like? How will your city’s climate shift, 50 years from now? Data scientist Derek Taylor explains his latest piece.
Africa Focus Data Journalism
How Data Journalism Is Changing the Face of Africa
Data journalism in Africa has made a powerful impact, from holding leaders accountable to refuting myths around domestic violence. But the field faces formidable challenges.