Accessibility Settings

color options

monochrome muted color dark

reading tools

isolation ruler

Tag

education

15 posts

Data Journalism

Data Journalism Top 10: Queen Elizabeth’s Reign, Arctic Fires, Taiwan Street Food, Brain Drain

Our weekly NodeXL and human curation of the most popular data journalism stories on Twitter features The Financial Times’ 10 charts visualizing developments in the United Kingdom during Elizabeth’s reign, The Marshall Project’s look at how government Covid-19 relief funds were used, and Taiwan Data Stories’ scrollytelling project about Taiwan’s iconic street food.

Data Journalism

Data Journalism Top 10: Pandemic Cocktails, Pricey Food, Zoonotic Diseases, the World’s Top Songs

If you have tried to mix cocktails at home lately, you’re not alone. Tired of waiting for bars and restaurants to reopen, more consumers have started buying premium alcohol, according to data published by the Financial Times. Our NodeXL #ddj mapping from March 1 to 7, which tracks the most popular data journalism stories on Twitter, also found an analysis by Bloomberg showing that global food prices have hit their highest level in six years, an explainer of the connection between bats and virus outbreaks by Reuters, an interactive piece on Atlantic currents by The New York Times, and a musical map by The Pudding.

Reporting Tools & Tips

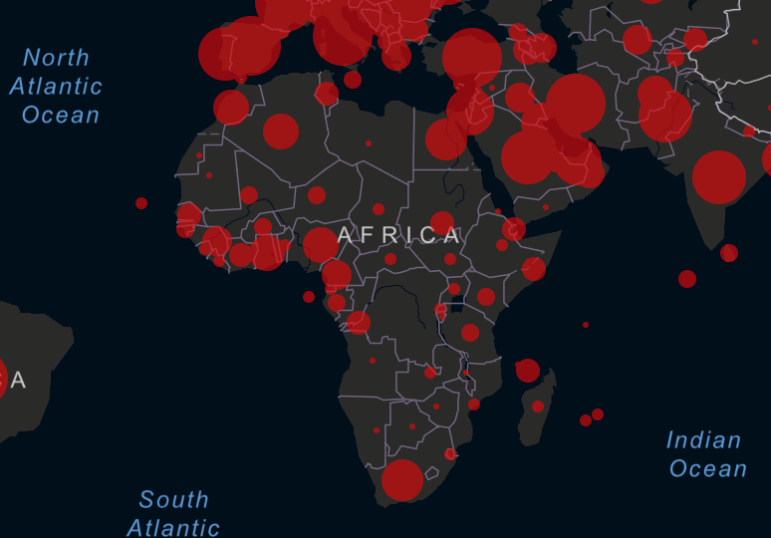
Reporting on COVID-19 in Africa: A Collaborative Story Idea List

What is the best way into the COVID-19 story? Pick an angle. No matter what your beat is, the pandemic is seeping into almost every story. In response, the Kampala-based African Centre for Media Excellence (ACME) created a running list of story ideas on COVID-19 which stretches across beats: from agriculture and food to the economy, education, religion, sports, and arts and entertainment.

Data Journalism

GIJN’s Data Journalism Top 10: London’s Murder Hotspots, Hungary’s Media Monopoly, Data Journalism’s Fallacies

What’s the global data journalism community tweeting about this week? Our NodeXL #ddj mapping from November 26 to December 2 finds @VRCCrimCam mapping London’s medieval murder hotspots, @geckoboard illustrating common data fallacies to avoid, @ddjournalism teases the beta launch of the Data Journalism Handbook 2.0, and @GoogleNewsInit displays its data journalism courses.

Data Journalism

GIJN’s Data Journalism Top 10: Number Jungles, Gender Gaps, Uber Maps, Brexit Woes

What’s the global data journalism community tweeting about this week? Our NodeXL #ddj mapping from November 5 to November 11 finds employment problems in the UK from @FinancialTimes, Polish data counter-narratives with @gazeta_wyborcza, cool geospatial analysis toys from @Uber, plus the launches of new data labs with @AlterEco_, data articles with @fstalph and @eborgesrey and data newsletters with @voydorg_en.

Covering the Extractives Industry: Big Data, New Tools, and Journalism

The extractives sector (oil, gas, and mining) continues to be an important subject for journalists, particularly in developing countries. Revenues from oil, gas and mining contribute substantially to GDP and in many cases make up the bulk of government revenue. Indeed, among 29 nations that in 2011 were implementing the Extractive Industries Transparency Initiative (EITI), 10 reported extractives revenues totaling over one-quarter of their respective government budgets (six of which were actually over 50%).