Case Studies
How to Adapt Membership Models and Events During the Pandemic
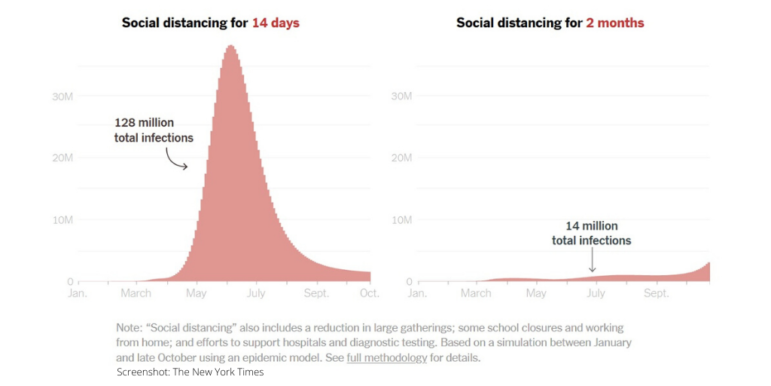
As coronavirus sweeps through communities around the world, the Membership Puzzle Project has shared examples from newsrooms around the world on how they have quickly adapted pillars of their membership programs and memberful routines to respond to the realities of this crisis.