
Data Journalism Top 10: Ukraine’s Destruction, Russia’s Isolation, 007’s Cars, Oscar Movies

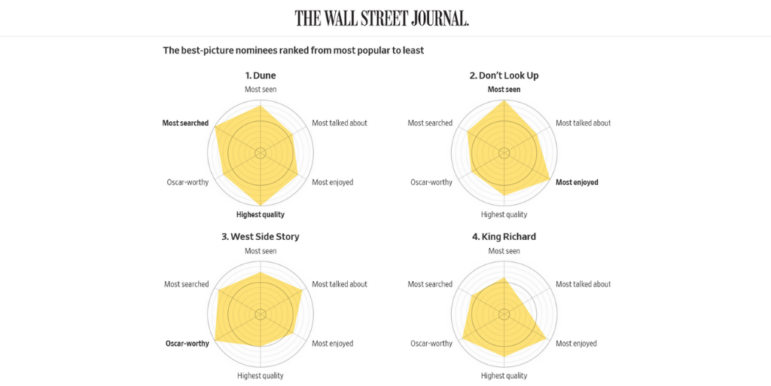
The Wall Street Journal polled audiences and tracked online chatter to determine which Oscar-nominated movies were the most popular. Image: Screenshot.
All eyes are still on the Russia-Ukraine war, with newsrooms tracking assets of sanctioned Russian oligarchs, cataloging the destruction of Ukraine, and monitoring the deglobalization of Russia as international brands pull out of the country. Our weekly NodeXL and human curation of the most popular data journalism stories on Twitter also highlights a survey on the wave of harassment against scientists since the start of the COVID-19 pandemic, a piece looking at carbon emissions in Germany, a visualization of vehicles featured in 25 James Bond movies, and a ranking of Oscar-nominated Best Picture movies.
#RussianAssetTracker
The Organized Crime and Corruption Reporting Project and its partners trawled data from land records, corporate registries, and offshore leaks, looking for assets owned by Russia’s oligarchs and their enablers. The team compiled these assets into a database: in each oligarch’s profile, one can search the individual’s asset by type, region, and value. Also worth a look: El Pais’ visualization, map, and searchable database of 40 Russian tycoons sanctioned by the European Union.
Identifying the Devastation in Ukraine
The New York Times identified the destruction of at least 1,500 civilian buildings, structures, and vehicles in Ukraine since Russia’s invasion on February 24 this year. The journalists tallied the number by examining thousands of verified photos and videos; descriptions and visual evidence from official announcements by Ukrainian military and government agencies; and reporting from its staff on the ground. The number included at least 23 hospitals and other healthcare facilities, 330 schools, 27 cultural buildings, and 900 houses and apartment buildings. Also check out the NYT Visual Investigation team’s piece highlighting logistical problems plaguing the Russian army’s advance based on the analysis of intercepted radio transmissions between Russian forces in Ukraine. Read summaries of both stories in tweet threads by Danielle Ivory and Christiaan Triebert.
De-globalizing Moscow
Just over one month since Russia’s invasion of Ukraine, hundreds of global companies have stopped, scaled back, or suspended operations in Russia, but some have maintained business as usual. The Washington Post visualized these decisions of some of the largest international firms. It also showed the impact of businesses pulling out of the country by photographing two popular shopping streets in its capital, Moscow. Once bustling with people, both streets now suffer from a dearth of consumers due to numerous closed stores, which include well-known luxury brands such as Prada, Dior, Chanel, and Hermès.
Evolution of War Graphics
In a tweet thread, geographer and cartographer Levi Westerveld posted four maps created by The New York Times on the Russia-Ukraine war over the course of the invasion. He highlighted how those graphics evolved and the varying impressions that each suggested to audiences. He pointed out that the Times’ use of large red arrows and almost opaque red color in the beginning indicated fast, large, and controlled overtaking of Ukraine by Russian forces, while its subsequent use of of more translucent, pink tones for Russian-occupied areas signified more complexity about the reality on the ground. Many people on Twitter believed that NYT changed its style of cartography due to earlier critiques, but others were of the view that NYT had just adapted its maps to show more detailed data as more information became available. See NYT’s maps tracking the conflict here.
Russia-Ukraine War Military Losses
How much equipment have Russia and Ukraine lost in the war over the past month? The independent Ukraine news site Texty — by combining its own staff reporting with data collected by Oryx, an open source intelligence blog — visualized the number and models of weapons and military vehicles that have been destroyed, damaged, abandoned, or captured on both sides of the war.
Harassment of COVID Researchers
The advent of the COVID-19 pandemic suddenly thrust many scientists into the spotlight. But along with this newfound fame came unexpected abuse, intimidation, and threats. Science Magazine sent a survey to 9,585 researchers who have published on COVID-19 to determine the extent of the problem. Of the 510 who responded, 38 percent reported at least one instance of harassment. And more than 70 percent of those who were attacked said they experienced little to no abuse before the pandemic began. The survey also looked at the correlation between the topics the scientists debated and those that attracted the most harassment, as well as the effect that the abuse had on them. Bonus: Don’t miss Dataviz Dispatch’s special collection of COVID-related trackers and dashboards from the past two years, as well as a MediaHack piece on lessons learned from building a COVID dashboard for Africa.
How the Wealthy Drive Climate Change
Traditionally, global climate politics holds the idea that richer countries produce a higher amount of greenhouse gasses and thus they have the responsibility to cut emissions faster than poorer nations. Bloomberg examined a different perspective of carbon inequality, based on an assessment by analysts from the World Inequality Lab. According to that organization’s World Inequality Report 2022, personal wealth might be a better indicator of sources of carbon emissions compared to national wealth. The richest 1 percent—the more than 60 million people earning at least US$109,000 a year—are by far the fastest-growing source of emissions, and they live all over the world even in poorer nations.
Germany’s Greenhouse Gases
According to a report by daily Süddeutsche Zeitung, just 30 companies are responsible for more than one third (36 percent) of all carbon emissions in Germany. This includes Thyssenkrupp, Uniper, Vattenfall, RWE, and Volkswagen. Readers can discover the total amount of carbon emissions in their district, and the source of it, using SZ’s interactive project.
Six Decades of James Bond’s Vehicles
This year’s Academy Awards paid tribute to six decades of James Bond films with a unique approach: having skateboarder Tony Hawk, snowboarder-skateboarder Shaun White, and surfer Kelly Slater present a montage of highlights from the series featuring Bonds from Sean Connery to Daniel Craig. Information design firm Baryon summarized and visualized the wide variety of vehicles used by James Bond on land, in the air, and on water, across 25 movies.
Popularity of Oscar Nominated Movies
How many of this year’s Oscar-nominated Best Pictures have you seen, or plan to see? The Wall Street Journal polled audiences and tracked online chatter to determine which movies were most popular, most searched, most enjoyed, and of the highest quality. The results suggest that consumers did not necessarily equate high-quality with enjoyable. See WSJ’s methodology for this piece here. Related story: Slate’s French-language site looks at how Oscar-nominated films are becoming less and less popular with the public over the years.
https://twitter.com/SophieWarnes/status/1507045157853704198
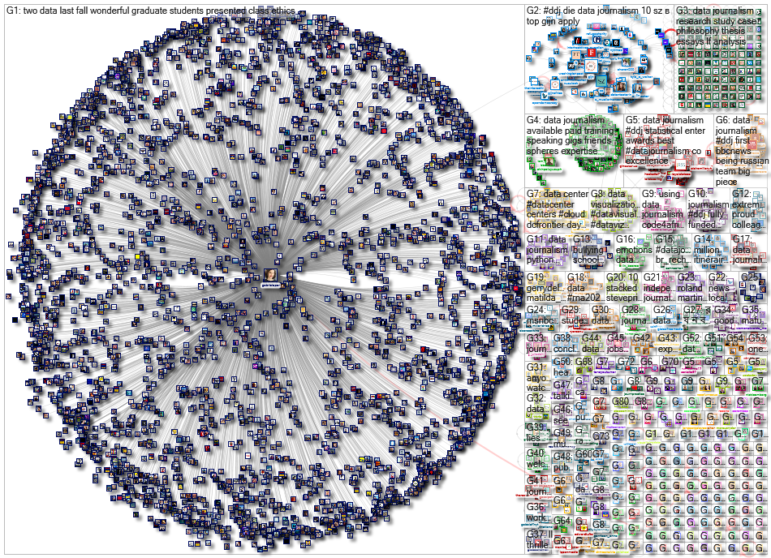
Thanks again to Marc Smith and Harald Meier of Connected Action for gathering the links and graphing them. The Top Ten #ddj list is curated weekly.
 Eunice Au is GIJN’s program manager. Previously, she was a Malaysia correspondent for Singapore’s The Straits Times, and a journalist at the New Straits Times. She has also written for The Sun, Malaysian Today, and Madam Chair.


