Data Journalism Top 10: The Rise of Big Tech, India’s Bad Vaccine Data, Why Data Journalists Need Safeguards
Read this article in


Four of the world’s most influential technology companies are based on the US West Coast. Amazon, Apple, Facebook, and Google have had an enormous impact on our daily lives. But how did Big Tech get so big? Our NodeXL #ddj mapping from April 19 to April 25, which tracks the most popular data journalism stories on Twitter each week, found The Washington Post showing how the success of these behemoths has been fueled by acquiring hundreds of smaller companies over the past decade. In this edition, we also feature IndiaSpend’s inquiry into faulty vaccine data from the Indian government, a list of the world’s top 1,000 climate scientists by Reuters, and a look at Europe’s growing rail network.
India’s Questionable Vaccine Data
India is going through one of the most intense COVID-19 crises since the start of the pandemic. The nation is hoping that vaccinations will help curb the spread of the virus, which has so far taken the lives of over 200,000 people. But journalism outlet IndiaSpend found that the government’s claims about the effectiveness of the two vaccines used in the country are based on incomplete and faulty data.
The Suicide Wave That Never Was
Life under lockdown has been difficult for everyone, but particularly so for people with symptoms of anxiety and depression. Last spring, US experts warned that the pandemic may lead to a wave of suicides, particularly among teenagers, based on increased calls to suicide hotlines and emergency-room psychiatric visits. But according to The Atlantic, the notion that lockdowns have caused a mental-health crisis is not backed up by the collected data.
How Big Tech Got So Big
From smartphones and computers to a range of digital services, America’s high-tech firms have used various products to attract global consumers and penetrate every aspect of our lives. Amazon, Apple, Facebook, and Google have grown bigger and bigger while competing in a league of their own. The Washington Post examined multiple data sets and studies to illustrate how hundreds of acquisitions have transformed these companies into behemoths of the tech industry.
Wildlife Traffickers and COVID-19
Tigers, ivory, rhino horns, and turtles. These are the four most trafficked wildlife commodities in Vietnam, a major destination and transit point in global trafficking networks. A year-long investigation by the Environmental Reporting Collective and the Vietnam-based Centre for Media and Development Initiatives examined 10 years of data from each of these four markets and found that illegal wildlife trafficking is continuing despite the effects of the pandemic.
The Hot List
Need an expert on climate change? Reuters’ data journalist Maurice Tamman compiled a list of the world’s top 1,000 climate academics and created a system to rank them. Tamman used data from Dimensions, the academic research portal of British-based technology company Digital Science, to calculate an average citation ratio for each scientist’s climate change papers and identify the most influential experts in this field.
Europe by Rail
Europe is one of the best regions to travel by rail, with a network that allows passengers to explore dozens of nations and cultures. The European Union is working to increase the number of direct rail links between major cities on the continent. An analysis by Italian think-tank Osservatorio Balcani Caucaso Transeuropa highlighted which cities are best connected by cross-border rail travel and looked into the future of a European single rail market.
Cutting Greenhouse Gas Emissions
US President Joe Biden has committed to cutting greenhouse gas emissions to half their 2005 levels by 2030. Achieving this will require a range of policies, including a focus on renewable energy and electric transport, and eliminating coal-fired power plants. None of these measures alone is enough to reach the target. So, The Wall Street Journal built a tool allowing its readers to pick their own approach by choosing from 11 different carbon-reduction actions.
The Problem with Education Data
Choosing which school to apply to is often based on what chance you have of being admitted. But official data can give a false impression of a school’s selectivity. An analysis published in the Columbia Journalism Review argues that, for years, The New York Times and other news outlets have used problematic data that exaggerates how hard it is to get into certain institutions.
Academics, Journalists, and Data
Data-driven storytelling has exploded during the pandemic as news outlets increasingly use numbers to explain complex narratives. One significant development is that journalists no longer solely rely on academics to source and analyze data — most large newsrooms have started doing that themselves. In an opinion piece for Undark Magazine, statistician Irineo Cabreros argues that a line has been crossed and cautions that journalists need transparency, safeguards, and time when doing independent data analysis.
Marketing Data-driven Journalism
Well-designed charts and graphics can make data reporting significantly more appealing and understandable to audiences on the internet. However, different platforms call for a different format. Deutsche Welle’s Innovation team analyzed four types of visual content to find out which storytelling approaches work best on Facebook, Twitter, Instagram, and YouTube.
Thanks again to Marc Smith and Harald Meier of Connected Action for gathering the links and graphing them. The Top Ten #ddj list is curated weekly.
 Peter Georgiev is GIJN’s social media and engagement editor. Previously, he was part of NBC News’ investigative unit in New York. He also worked as a correspondent for Bulgarian National Television and his reporting has been published by the Guardian, Deutsche Welle, and other international outlets.
For a look at NodeXL’s mapping on #ddj and data journalism on Twitter, check out this map.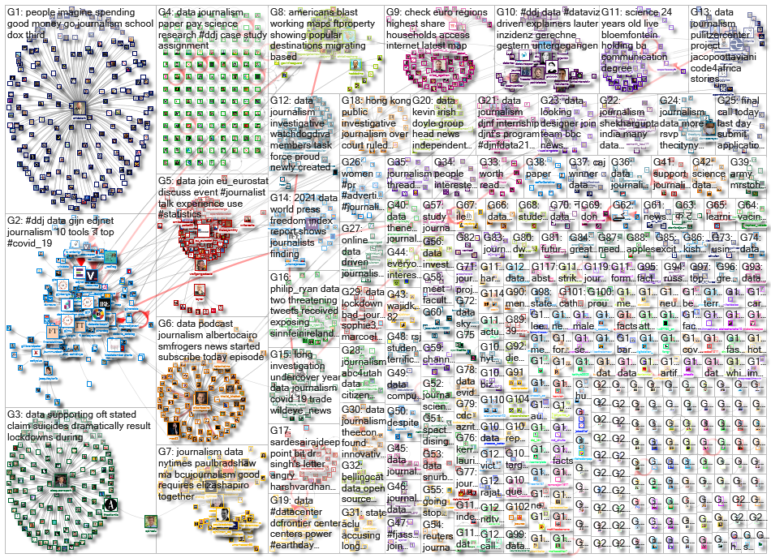

This work is licensed under a Creative Commons Attribution-NoDerivatives 4.0 International License
Republish our articles for free, online or in print, under a Creative Commons license.
Republish this article
This work is licensed under a Creative Commons Attribution-NoDerivatives 4.0 International License
Read Next

Data Journalism
How a WhatsApp Community Is Bringing India’s Data Storytellers Together
Recently, more than 400 people gathered in the Indian city of Bengaluru for VizChitra 2026, a conference on data visualization and storytelling — but that is only a small part of the story.

Climate Data Journalism
Turning the Threat to a Distant Glacier into a Local Story Through Data Visualization
New York Times climate and environmental graphics reporter Mira Rojanasakul discusses how her team visualized the sea level rise threat from the melting Thwaites Glacier in Antarctica.

Data Journalism
Making Trillions Make Sense: How Reuters Visualized the AI Economy
How do you make a trillion dollars feel real to someone who has never seen that much money? Vineet Khare and Mayank Bhatt faced that very challenge for their data-driven investigation into AI investment.

Data Journalism
How the Hindu Is Embedding AI Into Its Data Journalism
LLMs are quietly reshaping data journalism workflows at The Hindu, helping reporters process vast document sets, write scripts and build interactive tools.