Mapping Migrant Deaths in Singapore. Image: Screenshot, Migrant Death Map
Data Journalism Top 10: Migrant Deaths, Alps Skiing, Ukraine’s Outages, Deadly Deer
Read this article in

Step-By-Step Guide for Journalists on the Basics of Google Sheets

Tipsheet for Using Ocean Data in Your Investigations

No Coding Required: A Step-by-Step Guide to Scraping Websites With Data Miner

GIJC23 – The Future of Data Journalism: New Analytical Tools, Data Visualization, and AI
Bears, cougars, coyotes, snakes: there are plenty of dangerous animals in the United States that can harm humans, should they encounter them in the wrong place and at the wrong time. But this week’s top data journalism stories yielded a surprising number one for the nation’s deadliest animal — the deer, which, by the numbers, takes the prize for most fatalities because of the high number of deer-vehicle collisions every year.
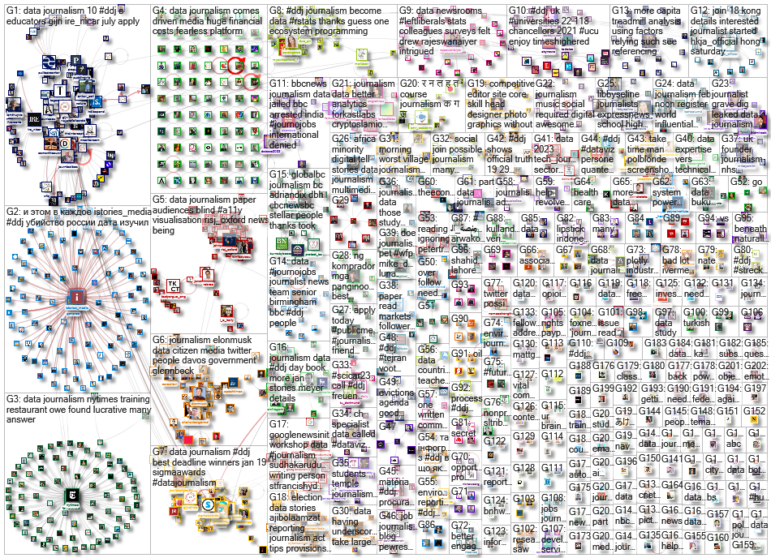
Our weekly NodeXL and human curation of the most popular data journalism stories on Twitter also features Texty’s mapping of power outages in Ukraine in relation to Russia’s strikes, Zeit Online’s look at the potential consequences of a proposed German parliament reform, CENOZO’s mapping of “authorized deforestation” in Mali and Côte D’Ivoire, and Le Temps’ analysis of where to ski in Switzerland to get the best bang for your buck.
Deadliest Animals in the US
For The Washington Post, Andrew van Dam examined car crash data in the US and discovered that “the deadliest beast in North America” is the deer. He analyzed more than one million animal-vehicle collisions compiled by a University of Washington study, whose authors estimated that deer were involved in more than 90% of collisions occurring between 1994 and 2021. His analysis also reveals the deadliest month and the deadliest states for deer-involved crashes, and other animals car drivers should fear.
Russian Attacks and Ukraine Power Outages
To find out the correlation between Russian missile strikes on Ukraine and recent power outages in Kyiv and Lviv, Ukrainian data journalism site Texty used information from readers, Telegram bots, and other open sources to compile the average number of outages per day in those two cities. The resulting infographic indicates when certain areas had electricity or suffered power outages, mapped against the dates of major Russian strikes.
German Parliament Reform
Germany’s “traffic light” government — a coalition of the Social Democratic Party, the Free Democratic Party, and the Green party — wants to reform voting laws, which would reduce the number of seats in parliament from 736 to 598. Reporters at Zeit Online translated the proposed reforms into an algorithm to see who would and wouldn’t have been elected in the 2021 general elections under the new rules.
Mapping ‘Authorized Deforestation’
Protected forests — designated through national conservation efforts or as part of international preservation projects — play an important role in maintaining biodiversity and fighting climate change. But some West African countries still issue mining permits to multinational companies in protected areas. The Norbert Zongo Cell for Investigative Journalism in West Africa (CENOZO) used open source data to demonstrate that industrial mining permits have been issued in protected forests in Mali and Côte D’Ivoire.
Crumbling Infrastructure in Russia
Russian independent media site IStories examined the data behind a common problem across Russia: accidents caused by dilapidated heating, sewage, and water supply systems. Journalists collected media reports of deaths and injuries caused by utility infrastructure failure over the past three years and found at least 29 people killed and 80 injured from burst hot water pipes. The newsroom also revealed an alarming level of deterioration in the utility networks across the country.
Alps Skiing: Snow Value for Money
After Europe’s winter heatwave, more snow has finally started to fall on Switzerland’s ski resorts — but snow cover remains hugely variable, depending on the region and altitude. For Swiss French language daily Le Temps, Duc-Quang Nguyen used Switzerland Tourism data to produce a graph for readers to check, at a glance and color-coded by region, which resorts have the most snow, how many slopes are open at each destination, and the prices for adult ski passes.
Rising Rents
Thanks to Russia’s war on Ukraine, post-Soviet states are seeing a higher influx of Russian citizens. By analyzing public data from real estate listings and official goverenment statistics, Armenian media Infocom found that the sudden increase in Russian migrants has resulted in a sharp rise in real estate prices in Armenia and Kazakhstan.
Hungary’s State Support for Expats
As part of a cross-border collaboration in 2020, investigative media outlet Átlátszó investigated Hungary’s state support of expatriate minorities abroad. Using charts, graphs, and maps, the team highlighted how €826 million (US$900 million) had been allocated to communities in Romania, Slovakia, Ukraine, and more. This piece has recently resurfaced on Twitter, after pro-state media in the landlocked nation used it as ammunition to attack Átlátszó and its editor-in-chief, Tamás Bodoky, as part of a smear campaign.
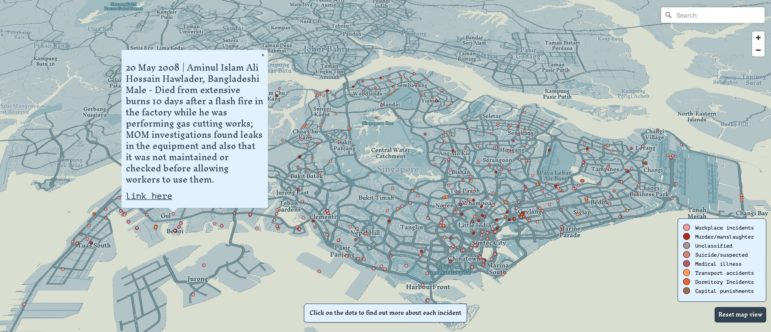
Mapping Migrant Deaths in Singapore
In a country that prides itself on keeping its borders open, migrant workers make up a significant share of Singapore’s population. But the picture is not all rosy. To honor the migrants who lost their lives in workplace-related incidents or due to abuse, an anonymous group of activists, with the help of data storytelling studio Kontinentalist, collected and mapped reports of migrant worker deaths in the island nation from January 2000 to August 2022. They found at least 455 deaths, and believe the true number to be higher.
Birth Dates and Success in Football
What’s the probability of a child becoming the next Neymar, Cristiano Ronaldo, or Luis Suárez? Brazilian daily Folha de São Paulo analyzed birthday data from nearly 13,000 professional footballer players and found that boys born in the beginning of the year are up to three times more likely to reach the elite world of football compared to those born in the last months of the year. Related: see this 2010 study that found a similar correlation between early birthdays and greater representation in North American professional hockey.
Bonus Item: Global Eyesores
What’s the most hideous building in your country? Where does it rank among the world’s most apalling buildings? Buildworld set out to determine a global top 10 of the ugliest architectural edifices by analyzing the sentiment of tweets commenting on building designs. The number one winner (or loser in this case)? The Scottish Parliament building in Edinburgh.
Thanks again to Marc Smith and Harald Meier of Connected Action for gathering the links and graphing them. GIJN’s Data Journalism Top 10 list is curated weekly.
 Eunice Au is GIJN’s global team manager. Previously, she was a Malaysia correspondent for Singapore’s The Straits Times, and a journalist at Malaysia’s New Straits Times. She has also written for The Sun, Malaysian Today, and Madam Chair.
 Alexa van Sickle is an associate editor at GIJN. She was previously a senior editor for the foreign correspondence magazine Roads and Kingdoms. She has also been an editor at the International Institute for Strategic Studies and a publisher at an international law non-profit in London. She lives in Vienna, Austria.
For a look at NodeXL’s mapping on #ddj and data journalism on Twitter, check out this map.
Step-By-Step Guide for Journalists on the Basics of Google Sheets
Tipsheet for Using Ocean Data in Your Investigations
No Coding Required: A Step-by-Step Guide to Scraping Websites With Data Miner
GIJC23 – The Future of Data Journalism: New Analytical Tools, Data Visualization, and AI

Turning the Threat to a Distant Glacier into a Local Story Through Data Visualization

One Name at a Time: How Die Zeit Built a Searchable Database of Nazi Party Members

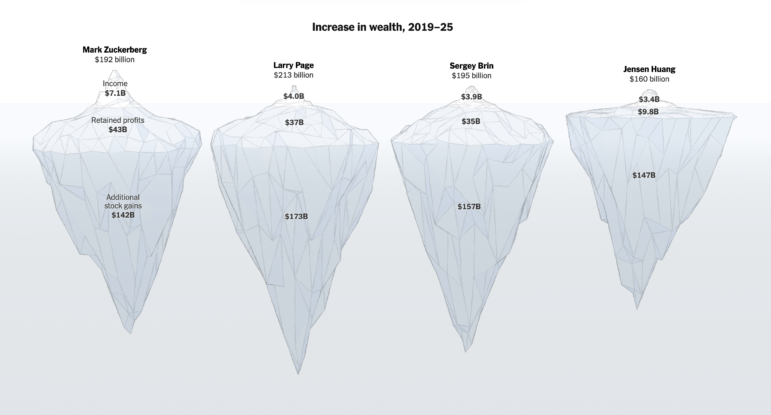
Visualizing a Trillion Dollars, India’s Warming Cities, Russian Mercenaries at Sea, and World Cup Player Physiques
‘Super’ El Niño Threat, Myanmar Villages Razed, California’s Billionaire Tax Bill, and South Africa’s Murder Rate

This work is licensed under a Creative Commons Attribution-NoDerivatives 4.0 International License
Republish our articles for free, online or in print, under a Creative Commons license.
Republish this article
This work is licensed under a Creative Commons Attribution-NoDerivatives 4.0 International License
Read Next
Climate Data Journalism
Turning the Threat to a Distant Glacier into a Local Story Through Data Visualization
New York Times climate and environmental graphics reporter Mira Rojanasakul discusses how her team visualized the sea level rise threat from the melting Thwaites Glacier in Antarctica.
Data Journalism
One Name at a Time: How Die Zeit Built a Searchable Database of Nazi Party Members
An online tool set up by the German newspaper Die Zeit, in cooperation with archives in Germany and in the United States, allows people to search several million Nazi Party membership cards.
Data Journalism Top 10
Visualizing a Trillion Dollars, India’s Warming Cities, Russian Mercenaries at Sea, and World Cup Player Physiques
Also highlighting how films portray Ukrainians, increasing tree cover in Spain, and how couples meet.
Data Journalism Top 10
‘Super’ El Niño Threat, Myanmar Villages Razed, California’s Billionaire Tax Bill, and South Africa’s Murder Rate
Also highlighting exploitation of journalists in Egypt, Argentina’s returning World Cup squad, and the strain on Singapore’s aging caregivers.