
Image: Shutterstock
Updating the Inverted Pyramid of Data Journalism
Read this article in

Step-By-Step Guide for Journalists on the Basics of Google Sheets

Tipsheet for Using Ocean Data in Your Investigations

No Coding Required: A Step-by-Step Guide to Scraping Websites With Data Miner

GIJC23 – The Future of Data Journalism: New Analytical Tools, Data Visualization, and AI
This post was originally published by Paul Bradshaw in the Online Journalism Blog and is reprinted here with permission.
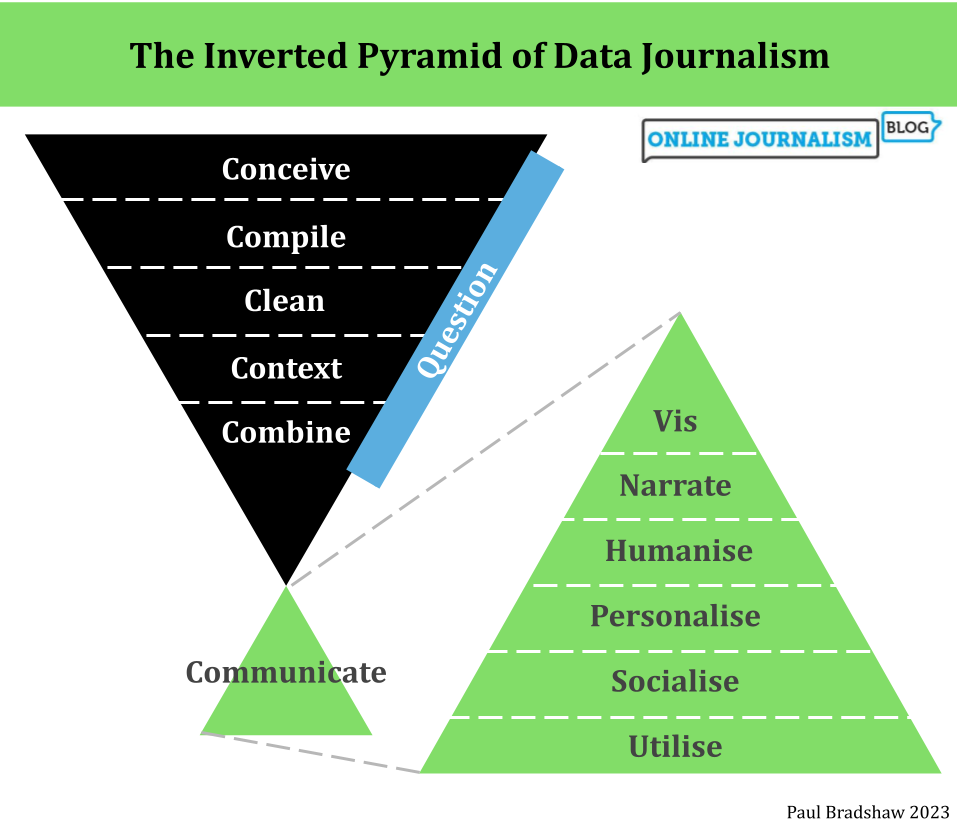
Image: Paul Bradshaw/Online Journalism Blog
It’s over a decade since I published the Inverted Pyramid of Data Journalism. The model has been translated into multiple languages, taught all over the world, and included in a number of books and research papers. But in that time the model has also developed and changed through discussion and teaching, so here’s a round-up of everything I’ve written or recommended on the different stages — along with a revised model in English (shown above; versions have been published before in German, Russian and Ukrainian!).
The most basic change to the Inverted Pyramid of Data Journalism is the recognition of a stage that precedes all others — idea generation — labeled ‘Conceive’ in the diagram above.
This is often a major stumbling block to people starting out with data journalism, and I’ve written a lot about it in recent years (see below for a full list).
The second major change is to make questioning more explicit as a process that (should) take place through all stages — not just in data analysis but in the way we question our sources, our ideas, and the reliability of the data itself.
Stage 1: Conceive
Data journalism ideas can range from the simplest angles for turning around stories quickly from new datasets to in-depth investigations. The following links cover both situations, and map out the different pathways that journalists follow to get there.
- Here are the angles journalists use most often to tell the stories in data
- This is where data journalists get their ideas from
- How to brainstorm COVID-19 data story ideas (these techniques can be applied to any topic)
- How to use the ‘4 stages of curiosity’ as a framework for investigations
- Empathy as an investigative tool: how to map systems to come up with story ideas
Stage 2: Compile
Data for a story can come from a variety of sources. The links below cover a range of scenarios, from identifying regular sources of data and APIs, to compiling data yourself through data entry or scraping, to using FOI or company accounts, and treating text as data.
- VIDEO: Where data journalists get data from
- How to: create a data news diary
- How to: plan a journalism project that needs data entry
- Data scraping for stories
- What Data Journalists Need to Know About Application Programming Interfaces (APIs)
- How to: find the data behind an interactive chart or map using the inspector
- VIDEO PLAYLIST: Finding stories in company accounts
- How to search for information in data black holes: Barbara Maseda and the Inventario project
- 11 FOI tips and other highlights from ‘FOIA Without the Lawyer’
- What do journalists do with large amounts of text?
- Using satellite data for journalism — tips from the experts
- See also the research paper (£): Scrape, Request, Collect, Repeat: How Data Journalists Around the World Transcend Obstacles to Public Data
Stage 3: Clean
Data cleaning can take up a disproportionate amount of time in a data project (although not the widely reported 80% factoid) — and yet it’s the area that’s perhaps least written about. Hadley Wickham’s Tidy Data is the exception to the rule here, while below I’ve listed some posts and a video which cover this stage.
- What is dirty data and how do I clean it? A great big guide for data journalists
- Cleaning data using Google Refine: a quick guide
- VIDEO: Computational thinking in data journalism
- What are regular expressions — and how to use them in Google Sheets to get data from text
- How to: fix spreadsheet dates that are in both US and UK formats
- Jonathan Stray’s Curious Journalist’s Guide to Data is also a great introduction to the issues in this area
- See also the research paper (£): Dirty Data in the Newsroom: Comparing Data Preparation in Journalism and Data Science
Stage 4: Context
I should probably write more about putting data into context, but the two main places where I have are:
- CCTV spending by councils/how many police officers would that pay? — statistics in context
- Here are the angles journalists use most often to tell the stories in data (which explains the different contexts to consider in each)
- I’d also recommend the free ebook “Data Feminism” which outlines some essential contextual factors that often shape data, or Caroline Criado Perez‘s book “Invisible Women.”
Framing of numbers was a feature. These three charts of the same thing tell different stories.
The first is in £s, the rest as %GDP pic.twitter.com/5c0BGrWWql
— Darian Woods (@DarianWoods) January 30, 2023
Stage 5: Combine
Providing context often means combining datasets. And the most common way of doing so is a spreadsheet function called VLOOKUP (or, increasingly, XLOOKUP). Last month I published this extract from my book “Finding Stories In Spreadsheets” on this process which walks through combining two datasets, and includes an embedded video walkthrough.
Questioning (at every stage)
Throughout all those stages — and the ‘communicate’ stage below — there is, as I said, questioning. Here are some posts that particularly relate to that:
- VIDEO: The 3 chords of data journalism
- A journalist’s introduction to network analysis
- The 7 habits of successful journalists: how do you develop scepticism?
- How to prevent confirmation bias affecting your journalism
- A journalist’s guide to cognitive bias (and how to avoid it)
Stage 6: Communicate
The ‘communicate’ stage of journalism can go in a number of directions, from data visualization to TV, and from short news updates to longform narrative journalism. Here are posts where I’ve explored a particular dimension of the storytelling stage.
- Visualisation: VIDEO: Mapping for data journalists
- Narration: Longform writing: how to avoid the ‘saggy middle’ — and end strongly
- Humanise: Data journalism in broadcast news and video: 27+ examples to inspire and educate
- Data journalism on radio, audio and podcasts
- Tim Harford on telling data stories with audio: “You need to keep simplifying”
- Personalise: VIDEO: Genres of interactivity: from ergodic storytelling to games
- VIDEO: How concepts of interactivity can help you with storytelling ideas
- Utilise: VIDEO: JavaScript Journalism and interactivity
 Paul Bradshaw leads both the MA in Data Journalism and the MA in Multiplatform and Mobile Journalism at Birmingham City University, and works as a consultant data journalist in the BBC England data unit.
Step-By-Step Guide for Journalists on the Basics of Google Sheets
Tipsheet for Using Ocean Data in Your Investigations
No Coding Required: A Step-by-Step Guide to Scraping Websites With Data Miner
GIJC23 – The Future of Data Journalism: New Analytical Tools, Data Visualization, and AI

How a WhatsApp Community Is Bringing India’s Data Storytellers Together

Turning the Threat to a Distant Glacier into a Local Story Through Data Visualization

One Name at a Time: How Die Zeit Built a Searchable Database of Nazi Party Members

Making Trillions Make Sense: How Reuters Visualized the AI Economy

This work is licensed under a Creative Commons Attribution-NoDerivatives 4.0 International License
Republish our articles for free, online or in print, under a Creative Commons license.
Republish this article
This work is licensed under a Creative Commons Attribution-NoDerivatives 4.0 International License
Read Next
Data Journalism
How a WhatsApp Community Is Bringing India’s Data Storytellers Together
Recently, more than 400 people gathered in the Indian city of Bengaluru for VizChitra 2026, a conference on data visualization and storytelling — but that is only a small part of the story.
Climate Data Journalism
Turning the Threat to a Distant Glacier into a Local Story Through Data Visualization
New York Times climate and environmental graphics reporter Mira Rojanasakul discusses how her team visualized the sea level rise threat from the melting Thwaites Glacier in Antarctica.
Data Journalism
One Name at a Time: How Die Zeit Built a Searchable Database of Nazi Party Members
An online tool set up by the German newspaper Die Zeit, in cooperation with archives in Germany and in the United States, allows people to search several million Nazi Party membership cards.
Data Journalism
Making Trillions Make Sense: How Reuters Visualized the AI Economy
How do you make a trillion dollars feel real to someone who has never seen that much money? Vineet Khare and Mayank Bhatt faced that very challenge for their data-driven investigation into AI investment.