
Image: GIJN
Summer Reading List for Data Journalists: For Those Who Believe in the Power of Storytelling with Numbers
Read this article in
Data journalism has evolved beyond merely working with verified statistics; it now encompasses the integration of data with emotion, ethics, and aesthetics to foster greater transparency, fairness, and understanding in the world.
Effective data journalism demands not only robust analytical skills but also empathy, visual literacy, data literacy, strategic thinking, and ethical sensitivity. Our summer book reading list, tailored for data journalists seeking to cultivate this multifaceted skill set, extends beyond conventional technical resources.
I have been teaching data journalism for 13 years, and for the past six years, I have been teaching data visualization, data management, big data, and insights. This experience has taught me that I need to develop an interdisciplinary approach, so when sharing reading materials, I have prioritized sources that include experiences from various sectors, such as sociology, marketing, or the experiences of a data visualization engineer at a software company or a graphic designer. When compiling this list, I considered both the primary sources that are part of my reading and teaching, as well as recommendations.
As a result, these selections encompass a diverse array of intellectual fields, ranging from feminist data inquiry to art-centered data visualization, ethical dilemmas to storytelling, and scientific narratives to pedagogical facilitation. It highlights the challenges of making femicide visible through data, the role of media production accelerated by artificial intelligence, and heartfelt narratives that convey to children or those unfamiliar with data that “numbers are not something to fear.”
This reading list is designed for data journalists who not only work with data but also engage with it critically — discussing, writing, collecting, processing, and analyzing it. Each book serves as a gateway: some enhance technical skills, others refine narrative abilities, and still others provide ethical and human insights that deepen our relationship with data.
Data is not merely information; in the right hands, it evolves into freedom, justice, visibility, meaning, remembrance, restoration, and action.
This list encompasses four continents and at least eight countries, offering a global perspective on data journalism. It also incorporates methodologies from various languages — English, German, Turkish, Urdu, and Indonesian — and disciplines, including engineering, journalism, sociology, visual arts, women’s studies, artificial intelligence, and education. This transformation elevates the field of data journalism from a purely technical compilation to a culturally and intellectually enriching reading experience.
If you’re ready, let’s get started.
New Releases
CHART: Designing Creative Data Visualizations from Charts to Art
Nadieh Bremer (2025)
Language: English
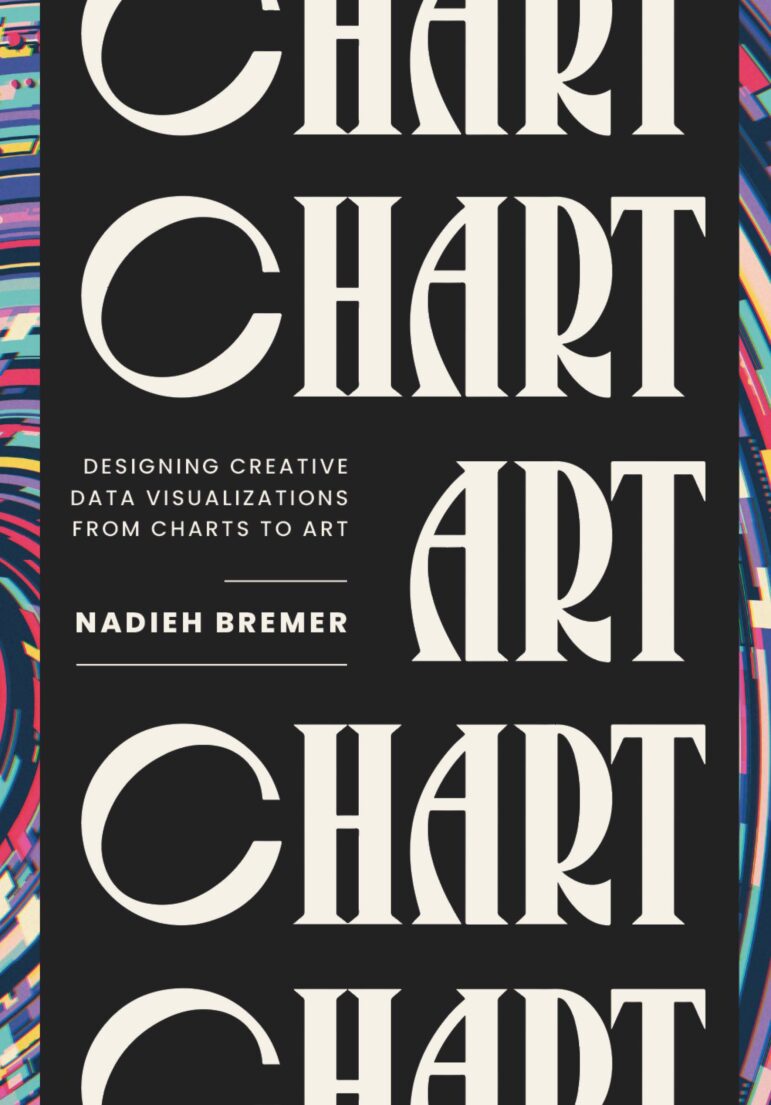
Image: Courtesy of Routledge publishing
Written by award-winning data scientist and data visualization designer Nadieh Bremer, this book is an impressive masterpiece that pushes the boundaries of data visualization. Over its 284 pages, it takes readers on a captivating journey from conventional graphics to artistic data representation. Through 13 creative lessons, Bremer explains how to transform data into something not only comprehensible but also striking, impactful, and emotionally resonant. Going beyond line charts, bar graphs, and pie charts, she redefines data representation through a broad range of techniques, including circular shapes, unique layouts, and representationally enhanced coding. The book features sketches, early drafts, and anecdotes about the creative process, exploring data visualization not only as a presentation tool but also as a form of storytelling and artistic expression. Showcasing Bremer’s 10 years of experience in the field, this book is filled with international examples and serves as a powerful source of inspiration for data journalists, designers, and anyone eager to express their creativity through data. Bremer’s unique approach blurs the line between data and art, transforming both the reader’s technical and aesthetic perspectives. Relevant sections of the book can be accessed on request.
ڈیٹا وژولائزیشن” Data Visualization (Set)
Sana Rasheed and Zeeshan ul Hassan (2025)
Language: Urdu, English
This four-book set provides practical methods for swiftly extracting meaning from data and includes the titles “Data Visualization in Tableau,” “Data Visualization,” “Power BI,” and “Power BI (Advance).” Together, they serve as an instructive guide for data journalists, communication students, faculty, researchers, and anyone interested in this field, helping them identify meaningful patterns within exponentially growing datasets using common visualization tools. Written in both Urdu and English, these books are a unique resource for data journalists seeking effective data storytelling, functional graphical representation, and the creation of analytical dashboards. The set covers fundamental principles and concepts of data visualization while offering examples of how to utilize tools such as Excel, Tableau, Power BI, and Python (including Matplotlib and Seaborn), all of which are readily accessible to data journalists. It addresses everything from selecting the appropriate chart type and functions to creating the right visualization format and producing statistically legible charts, all supported by up-to-date examples. Additionally, these books provide a comprehensive perspective on the visual literacy of data journalists. You can also access author Sana Rasheed’s GitHub page here to follow her current work.
Counting Feminicide: Data Feminism in Action
Catherine D’Ignazio (2024)
Language: English
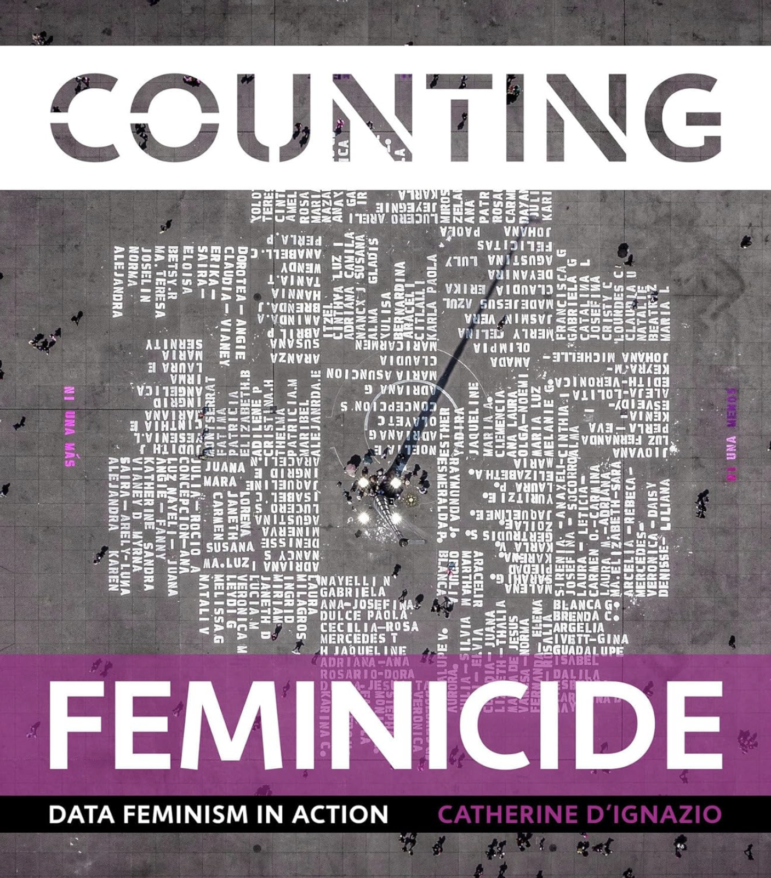
Image: Courtesy of the MIT Press
In this book, academic Catherine D’Ignazio examines the relationship between data and feminism from a compelling perspective. It details how feminist data activists in Latin America systematically document femicide/feminicide (gender-based murders of women and girls), thereby redefining the conventional approach to data science through the lenses of “care,” “memory,” and “justice.” Essentially, if you’re not counted, it’s like you don’t exist! Drawing on her collaborative research project “Data Against Feminicide,” D’Ignazio demonstrates how activists, researchers, data experts, and journalists fact-check information from media, social networks, and field sources, and how they disseminate this data in a variety of creative ways, including through political narratives, public awareness-raising, and policy reform and transformation. She presents data not only as a tool for analysis but also as a form of community healing and as a collective struggle against structural inequality. Furthermore, by revealing how the system renders invisible the truths that cannot be counted — loss, suffering, and voicelessness — she explains how feminist data practice, by recording the lived experience of each individual, transforms into a demand for justice at both the individual and societal levels. The book underscores the quest for equality, bridges data science, women’s studies, social movements, and human rights practices, and offers a powerful and transformative read for readers who embrace data as a technical, emotional, ethical, and political tool.
Handbuch Daten und KI im Journalismus (Handbook on Data and AI in Journalism)
Christina Elmer, Lorenz Matzat (2024)
Language: German
Written by academics Christina Elmer and Lorenz Matzat, this just-released book serves as a comprehensive guide to the integration of data journalism and artificial intelligence (AI) in the field of journalism. It offers in-depth insights and practical advice on strengthening essential journalistic skills, including data analysis, data visualization, data collection, and data processing through the use of AI. Additionally, the book presents examples of the future of data journalism and discusses how emerging technologies in this domain will benefit journalists. It specifically examines how AI tools can empower more efficient data journalism. This book equips journalists not only with techniques for data collection and analysis but also with strategies to address the ethical and practical challenges associated with these tools. It is an indispensable resource for those interested in data journalism, enabling them to adapt to modern technologies, improve clarity, vocabulary, and technical accuracy to produce compelling, accurate stories.
Veri Gazeteciliği ve Veri Manipülasyonu (Data Journalism and Data Manipulation)
Ayşe Yalman (2024)
Language: Turkish

Image: Courtesy of Nobel Academic Publishing
This book by Dr. Ayşe Yalman serves as a comprehensive resource on the appropriate use of data in journalism — establishing the foundations of data journalism, detailing how journalists can accurately collect and analyze data, derive meaningful insights, and present information through precise visualizations. It also tackles the issue of data manipulation, highlighting the ethical implications of misleading and distorted data presentations, which are illustrated with examples, underscoring the necessity for journalists to prioritize transparency, accuracy, and ethical responsibilities. This book is an invaluable guide for journalists seeking to effectively narrate stories using data without distortion, ensuring accuracy and reliability. It covers how to select trustworthy open data sources and apply appropriate analytical techniques. It provides insights into data analysis and visualization methods, offers solutions for navigating ethical dilemmas encountered in data journalism, and outlines how data journalism is practiced in Turkey. You can access the book’s table of contents and select chapters via this link.
Humanizing Data Strategy: Leading Data with the Head and the Heart
Tiankai Feng (2024)
Language: English
Written by Tiankai Feng, director of data and AI strategy at the global tech consultancy Thoughtworks, this compact book presents a rational framework for understanding the similarities between humans and data. Data journalists often encounter challenges in data strategy when dealing with high-public-interest information, which can result in missed opportunities for promoting the public good. Feng provides methods for reshaping data strategies through a human-centered approach. He also emphasizes the significance of human emotions, biases, and motivations in data strategy by introducing the 5C framework, which comprises the core components: competence, collaboration, communication, creativity, and conscience. He argues that aligning these components with business, project, or story objectives can facilitate both technical and cultural transformation. Feng makes complex strategic concepts more accessible and engaging by drawing on his professional experience, personal anecdotes, and creative elements such as humor, music, and memes. Additionally, the book offers a candid critique of common pitfalls in data strategies and provides clear roadmaps for teams aiming to cultivate a sustainable, ethical, and effective data culture.
Panduan Praktis Belajar Jurnalisme Data (Practical Guide to Learning Data Journalism)
Utami Diah Kusumawati (2024)
Language: Indonesian

Image: Screenshot, Leksika
This seven-chapter e-book by researcher Utami Diah Kusumawati provides practical suggestions for quickly acquiring essential skills, ranging from data cleaning to data analysis and visualization. The book examines the training offered to data journalists in Indonesia and abroad, emphasizing the differences between disciplines and identifying teaching and learning needs. Each chapter outlines the data journalism process step by step, covering topics such as data mining, basic and advanced data analysis, data visualization, and discovering news angles via commonly used computer applications and software by professional data journalists, including MS Excel, Google Sheets, OpenRefine, Tabula, Flourish, and QGIS. Additionally, each chapter features links to the datasets used in the exercises, enabling students and journalists to download the datasets directly for their own use. This hands-on teaching approach encourages students, journalists, and instructors to engage with data journalism through a comprehensive, accessible guide.
Classic Reads
Building Science Graphics: An Illustrated Guide to Communicating Science through Diagrams and Visualizations
Jen Christiansen (2022)
Language: English
Written by senior graphics editor Jen Christiansen, this book is an invaluable resource for anyone seeking to convey scientific information through effective visuals. Christiansen draws on her extensive experience in visual editing at Scientific American magazine, skillfully combining the technical intricacies and aesthetic aspects of science communication. The book encompasses the entire process of creating diagrams and scientific visualizations, guiding readers through each step — from idea development and drafting to fact-checking and style selection. The book offers strategies for ensuring both accurate information transfer and memorable visual representation, while Christiansen also argues that graphic representation is not only a means of conveying information but also a powerful form of communication that contributes to storytelling. Packed with rich visual examples, case studies, and expert opinions, the book stands out as an indispensable resource, especially for those seeking to simplify scientific complexity and effectively present it to a wider audience. Christiansen teaches readers not only the tools of graphic design but also the psychology of the viewer and the power of visual storytelling. Rich with examples and illustrations, the book provides a step-by-step guide for researchers, academics, journalists, and infographic designers in effectively and ethically presenting scientific information. It also serves as a “where to start?” resource.
I’m Not a Numbers Person: How to Make Good Decisions in a Data-Rich World
Selena Fisk (2023)
Language: English

Image: Courtesy of Major Street publishing
Selena Fisk’s 192-page book serves as a useful resource for anyone who struggles with numbers or feels hesitant to engage with data. Fisk contends that data should not be feared or viewed as complicated; rather, with the right questions, straightforward explanations, and a quest for meaning, anyone can read, analyze, and enhance their decision-making. Indeed, data journalism can be particularly beneficial for those at the start of their careers. Drawing on her teaching and leadership experience, she provides practical examples that resonate with professionals in education, social services, and healthcare, illustrating that data can convey meaning not only through graphs and tables but also through narratives and human context. With its empathy-focused, non-judgmental approach, this book democratizes data literacy and offers a transformative starting point for anyone who says: “I don’t understand numbers.” By arguing that data literacy is not exclusive to analysts or those proficient in mathematics. Fisk shows how everyone can cultivate their skills in data-based thinking, production, and writing. This approach, which emphasizes “understanding and sharing data” rather than merely “speaking to data,” offers a perspective that can lead to more conscious, transparent, and effective decision-making. In this book, Fisk has crafted a warm invitation for those who shy away from data and has provided a profoundly humane roadmap for the curious.
DataStory: Explain Data and Inspire Action Through Story
Nancy Duarte (2019)
Language: English
In this book on data narratives, communication expert Nancy Duarte underscores the significance of storytelling, explaining how storytelling can open doors and how, when combined with data, it can transform our understanding of the world. She argues that presentations, reports, and analyses in the realm of data are often laden with cold, mechanical figures, while genuine change and engagement can be achieved through storytelling. The book illustrates how to convert data into an effective storyline — not merely reporting it, but imbuing it with meaning, mobilizing the audience, and guiding strategic decisions. Numerous examples demonstrate how to structure graphs, tables, and text, offering simple yet powerful communication tools. By fostering an emotional connection between data and people, Duarte’s narrative prioritizes not only the explanation of insights but also the inspiration and motivation for action. She addresses the issue of “data without impact” and aims to provide a robust narrative framework to resolve it.
W. E. B. Du Bois’s Data Portraits: Visualizing Black America
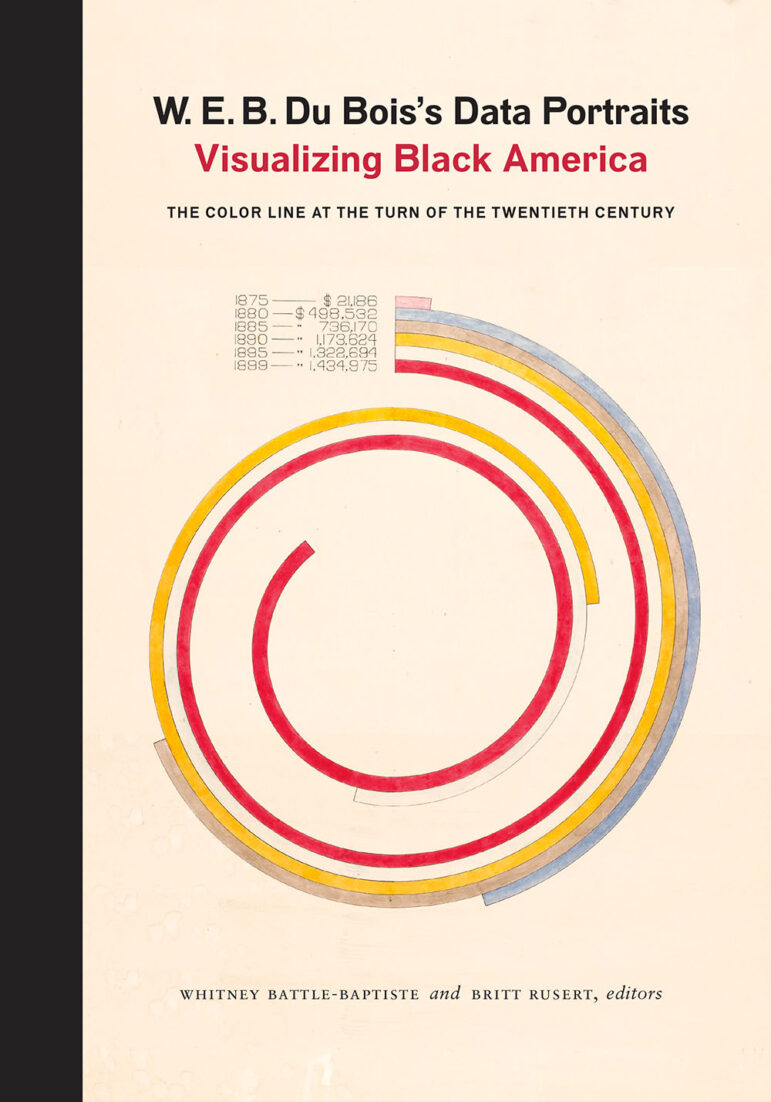
Image: Courtesy of Chronicle Books
Whitney Battle-Baptiste and Britt Rusert (Editors) (2018)
Language: English
This tome connects contemporary readers with the groundbreaking infographic works of W. E. B. Du Bois, one of America’s most significant sociologists, historians, and civil rights advocates, focusing in particular on the work he prepared for the 1900 Paris Exposition. The book charts the development of the African-American community in areas such as education, property, labor, and population through statistical data, while serving as a visual tool to document the racial injustices of the era. With striking hand-drawn diagrams, Du Bois and his team not only presented data but also did so artistically, honoring the narrative of Black Americans. Colorful graphics, circular diagrams, and creatively arranged charts take both an aesthetic and political stance, demonstrating that data visualization can be not only a technical endeavor but also an ethical and cultural form of expression. This work stands at the intersection of visual sociology, the politics of race and representation, and data art. It is a historical legacy that illuminates the past while inspiring the present and future. Even today, it deserves a place on every data journalist’s reading list.
 Pinar Dag is GIJN’s Turkish Editor. She is also a lecturer in the new media department of Kadir Has University and the co-founder of the Data Literacy Association (DLA), Data Journalism Platform Turkey, and DağMedya. Since 2012, Pinar has been organizing workshops for journalists on these issues and, for the past three years, has been on the pre-jury of the Sigma Data Journalism Awards.

Basic Data Journalism Tips for Editors

My Favorite Tools: Venezuela’s Lisseth Boon on Design and Data Visualization

Document of the Day: Visual Vocabulary

2025 Conference Resources

From Mexico to South Africa, Brazil to the Philippines: GIJN’s Investigative Bookshelf

GIJN Bookshelf: 9 Investigative Titles to Better Understand Latin America

From Data to Storytelling: Concept and Design Tips from the Financial Times’ John Burn-Murdoch

How Publishing Investigations as Books Can Add Depth, Increase Visibility, and Fight Censorship

This work is licensed under a Creative Commons Attribution-NoDerivatives 4.0 International License
Republish our articles for free, online or in print, under a Creative Commons license.
Republish this article
This work is licensed under a Creative Commons Attribution-NoDerivatives 4.0 International License
Read Next
News & Analysis
From Mexico to South Africa, Brazil to the Philippines: GIJN’s Investigative Bookshelf
Featuring titles that address historic wrongdoing, unpack corporate secrets, and reveal misconduct that the powerful would rather remain hidden.
News & Analysis
GIJN Bookshelf: 9 Investigative Titles to Better Understand Latin America
This latest installment of the GIJN Bookshelf offers a compilation of recommended investigative books from reporters across Latin America.
Data Journalism
From Data to Storytelling: Concept and Design Tips from the Financial Times’ John Burn-Murdoch
The chief data reporter for the Financial Times discusses how he considers the use of text, color, and annotation to aid visual storytelling through charts and graphics.
How Publishing Investigations as Books Can Add Depth, Increase Visibility, and Fight Censorship
In this story, several investigative journalists from Mexico speak about the experience of turning their exposés into books.