Tips for Reporters Seeking to Reveal the Scale of Inequality


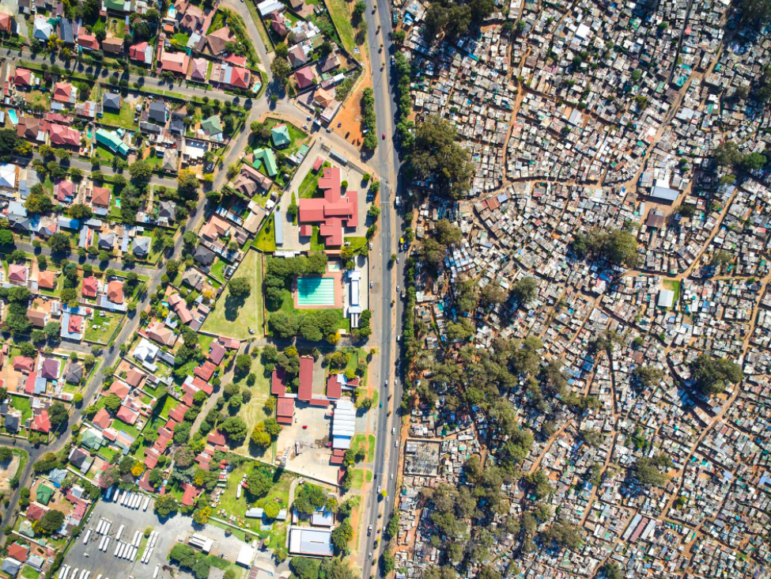
A stark divide: The suburb of Primrose sits alongside the Makause township near Johannesburg, South Africa. Image: Courtesy of Johnny Miller
Every now and then, a data point on inequality emerges that is so clear or shocking that numbers are enough to grab the attention of audiences and policymakers. For instance, in 2017, an investigation by The Boston Globe’s Spotlight team found that while the median net worth of white households in Boston was $247,500, the median net worth of non-immigrant Black households in the city was $8. The shock and disgust at this single digit figure had several impacts, including the launch of a Black Economic Council for the region, and several policy interventions.
But, in general, data on the gap between rich and poor, privileged and marginalized, tends to be more nuanced, hard to find, or buried in ‘Gini ratios,’ a figure which shows a population’s disproportionate share of income or wealth. Consequently, journalists often need other approaches to explain the crisis of inequality growing around the world.
It is clear that inequality has become one of the issues of our day, fueling political movements, calls for change, and attempts to level the playing field around the world.
According to one recent Oxfam report: “COVID-19 has the potential to increase economic inequality in almost every country at once, the first time this has happened since records began.” It noted that the world’s 1,000 richest individuals have already recovered their economic losses from COVID-19, while it “could take more than a decade for the world’s poorest to recover.” The researchers also found that women were the greatest economic victims of the COVID-19 pandemic, losing 64 million jobs and more than $800 billion in income.
An alternative approach to covering inequalities involves new visualization tools that can highlight key data and demonstrate the true scale of those gaps.

Created with Datawrapper, this scatterplot shows the correlation between wealth and life expectancy, by country and population size. Graphic: Courtesy of Alberto Cairo
Alberto Cairo, a data visualization expert at the University of Miami, told GIJN how scatterplot graphs, created with tools like Datawrapper, can effectively show the correlation between wealth and life expectancy, by country. The New York Times has used fluid mobility charts to dramatically show how systemic racism drags even Black men brought up in wealthy families into lower income categories in the United States. There are also scrolling graphic techniques to show the absurdity of the gap between working-class wealth and billionaire wealth, like this simple graphic by Matt Korostoff last year.
In addition, the BBC has shown how audiographs – which use sounds to represent data points, using tools like TwoTone — can help audiences comprehend highly unequal numbers. They used the “clink” sound of gold bricks to illustrate the stunning discrepancy between the growth of workers’ wages and corporate profits in the US since 2009.
Meanwhile, reporters need resources to mitigate the effect of a common lack of diversity in their own newsrooms when covering poverty. Two reporters who grew up in poverty produced a tip sheet for The Journalist’s Resource at Harvard University, which explains, for instance, why phrases like “poverty-ridden” can be demeaning, how to avoid stereotyping, and why, above all, reporters need to “spend a lot of time with people who are very different from you.”
Exposing Inequality from Above

Image: Tuca Vieira’s famous 2004 image of the sharp divide between the Paraisópolis favela and opulent apartments in São Paulo’s Morumbi suburb. Image: Courtesy of Tuca Vieira
Aerial photography has emerged as one of the most powerful approaches to uncovering the chasm of wealth and resources between communities.
Brazilian freelance photographer Tuca Vieira took arguably the world’s most iconic picture of inequality in 2004, for the Folha de São Paulo newspaper. The photo, taken from a helicopter, shows a vertical stack of swimming pools arrayed up the side of an opulent apartment building that looms over the overcrowded Paraisópolis favela in São Paulo.
“My picture is used in so many places, but what pleases me most is that it is used in school books,” says Vieira. “Inequality was already terrible, but then we had this pandemic, and it seems that it has suddenly gotten much worse, even as the billionaires gained unbelievable new wealth in that short time.”
While many 20th-century urban planners around the world corralled their city’s labor force into townships, slums, or favelas a few miles from city outskirts, Vieira says their subsequent spread — and the growth of informal settlements in spaces in between — now often sees rich and poor separated only by a road or fence. This phenomenon, he says, provides journalists with the chance to reveal the meaning of wealth gap data in a single image.
But he warns that aerial photos need to be presented in conjunction with ground-based images, to show the realities of individual lives, and some lesser-known evils of inequality. Vieira has continued to document inequities and recently published a book featuring more than 200 photographs that explore how differently communities in the city live.
“Inequality is not just about money and resources, it’s also about dignity, health, and humiliation, and policy stupidity,” he says. “If you want people to stop and think, you need impact in the image, but impact with good context and data.”
He added: “This notion of meritocracy — that if you only play by the rules and you work hard, you can make it — it’s not true; the system really is unfair, and I think this kind of photography can show that.”
But helicopters are expensive, and satellite images are lower resolution, and hard to direct.
For some experts, the new era of low-cost drones not only offers reporters a breakthrough in accessible aerial imagery, but also a powerful platform for data gathering and 3D modeling.

Slums line Mumbai’s Mithi River near the National Stock Exchange. Image: Courtesy of Johnny Miller
One social justice nonprofit, Unequal Scenes, has generated widespread awareness of chronic urban inequality — and triggered new conversations about policy solutions — through the use of drone imagery.
Its founder, Johnny Miller, has photographed rich and poor communities in close proximity, from above, in more than two dozen cities, from Seattle to Mumbai and Mexico City. One photograph from South Africa was used for a Time magazine cover image in May 2019.
Miller is also a co-founder of africanDRONE — a nonprofit that supports “drones for good” in Africa, and helps newsrooms and civil society organizations understand local license regulations, find post-production expertise, reduce drone costs, and connect with “civic drone pilots.” The organization has helped secure drone footage for investigative projects at News24, Carte Blanche, and the Sunday Times in South Africa.
“I think the Unequal Scenes project was a game-changer for how people who communicate inequality could show it in one, static image,” says Miller. “There’s not that many images out there showing wealth and poverty side by side, which is weird, but much of it is hidden from the street, though not from the air.”
The project is clear about its activist intent: “Unequal Scenes is an act of defiance. I defy the traditional power structures that keep these inequalities hidden so well from every direction except directly above. If the images provoke uncomfortable feelings of fear, despair, or an unsettling realization of complicity — good.”
Hidden Deprivation: A Personal Shock

The Palmiet Road informal settlement alongside the 6th hole of the Papwa Sewgolum Golf Course. Image: Courtesy of Johnny Miller
I can personally attest to this jarring impact. I had no idea that I was party to a horrible social injustice when I teed up at the Papwa Sewgolum Golf Course in South Africa a few years ago. On the contrary: I was happy to try out my limited golf skills on a course named in honor of an anti-Apartheid hero. In 1965, Sewsunker “Papwa” Sewgolum — a self-taught player of Indian descent — defeated the great Gary Player to win a provincial tournament, but had to receive his trophy in the rain outdoors because non-whites were not allowed to enter the clubhouse.
So, on the sixth hole, after I hooked my drive wildly over the trees that lined the left of the perfectly mown fairway, I simply took two penalty strokes and played on.
Last month, I scrolled through the powerful images on Unequal Scenes, which I’d heard were being widely shared and discussed by journalists investigating poverty and inequality. I was aghast to stumble upon an aerial image of that same sixth hole in South Africa — showing a slum packed tightly against that left fence; unspaced shacks running the entire length of the vast, lush fairway I’d walked.
The image — captured by one of Miller’s drones in 2018 — revealed that the Palmiet Road informal settlement, with no proper sanitation, had spread to the very border of privileged leisure, where space was plentiful, and fresh water was pumped onto acres of grass. My golf ball may have fallen on one of those shacks — or worse — and yet, despite my years of reporting on segregation and poverty in the region, I had no idea that settlement was there at all.
Miller says my visceral, unsettled reaction to the image is typical of many responses he sees to the project’s imagery — a useful reaction, he says, in jolting misperceptions about segregation and the scale and proximity of deprivation in unequal societies.
It took the massive devastation unleashed by Hurricane Katrina in 2005 for many Americans to understand the scale of entrenched deprivation in New Orleans. And only after a devastating 2017 fire at a working-class residential building, Grenfell Tower, did many Britons wake up to searing inequities in their most affluent neighborhoods. Some 72 people — 85% of them people of color – died when a massive fire engulfed Grenfell Tower, located in London’s otherwise affluent Kensington borough. Several newsroom investigations revealed that local authorities failed to spend sufficient money on fire protection at the tower — and even claims that rich neighbors pressured officials to direct the few resources allocated to Grenfell to beautifying its exterior, so they wouldn’t have to live near an eyesore. Meanwhile, needed fire protection upgrades were neglected.
For Miller, low-cost drones represent a better way to warn of growing, large-scale injustice — at least, in places where regulations allow pilots to fly them on behalf of newsrooms.

The opulence of the Jurujuba yacht club on the right contrasts with the crowded Guanabara Bay fishing colony, which is on the left, in Brazil. Image: Courtesy of Johnny Miller
He says the more important impact of inequality drone imagery is that it can engage a wider audience — because its remoteness generates conceptual, rather than emotional, reactions.
“Between social justice campaigners and conservatives, there are all of these people in the middle you need in the conversation about inequality, and you can put them off with emotionally charged images of crying children, or a wealthy banker next to a homeless person,” says Miller. “With drone imagery, you can present them with something that looks like a puzzle, and they have to figure it out for themselves.”
As freelance researcher and writer Monika Sengul-Jones recently explained, drones have helped reporters cover events too dangerous to attend in person, check facts, and drive data-led stories with heat-mapping, 3D modeling, and remote sensing. While noting the heavy expense of commercial drones, she said reporters in countries with freedom of information laws can request drone footage taken by law enforcement and other government agencies.
But Sengul-Jones warned that “journalists should first remember that drones were initially developed and used for surveillance, military reconnaissance, and targeted killing.”
“Even though they were initially used largely in horrible ways, I think drones are a democratic revolution,” Miller says. “Just like individual cameras on cell phones were. The ability for an individual to fly above a city and show what’s on the ground has never happened before in history — that was the domain of governments and the superrich until about 2012, then all these low-cost drones came on the market, and you can just plug in GPS positions.”
He says the africanDRONE model could be expanded, to offer drone services at reduced rates, or even pro bono, to under-resourced newsrooms, along with advice related to regulations and broader data-use options.
“AfricanDRONE has had some huge successes — we really pioneered drone journalism in South Africa,” he explained. “We did a story on illegal horse racing in the Western Cape, where gangs would steal horses from farms and race them for money. We had pilots — who envision themselves as future investigative reporters — who went out and tracked these people, and got coverage of the race and put it on [investigative TV series] Carte Blanche.”
Miller says a healthy consensus is emerging between pilots, nonprofits, and newsrooms that safety — particularly for people under the drone flight path — is paramount.
“I’ve found most editors don’t worry too much about the legal side of things and the regulatory gray areas, though editors do want things to be safe,” he adds. “Keeping everyone safe on the ground is sort of our domain.”
Miller says the next project for Unequal Scenes is a collaborative project to visually investigate inequality and marginalization in New York City.
“Drones are flat-out illegal in New York City, in terms of a city statute,” he notes. “How to tell stories of inequality through other non-traditional means? That’s what I’m thinking about now.”
Additional Resources
A Guide to Journalism’s Drone-Powered Future
My Favorite Tools: Alberto Cairo on Data Visualization
GIJN Resource Center: International Sources for Investigating Poverty
 Rowan Philp is a reporter for GIJN. Rowan was formerly chief reporter for South Africa’s Sunday Times. As a foreign correspondent, he has reported on news, politics, corruption, and conflict from more than two dozen countries around the world.

This work is licensed under a Creative Commons Attribution-NoDerivatives 4.0 International License
Republish our articles for free, online or in print, under a Creative Commons license.
Republish this article
This work is licensed under a Creative Commons Attribution-NoDerivatives 4.0 International License
Read Next
Reporting Tools & Tips
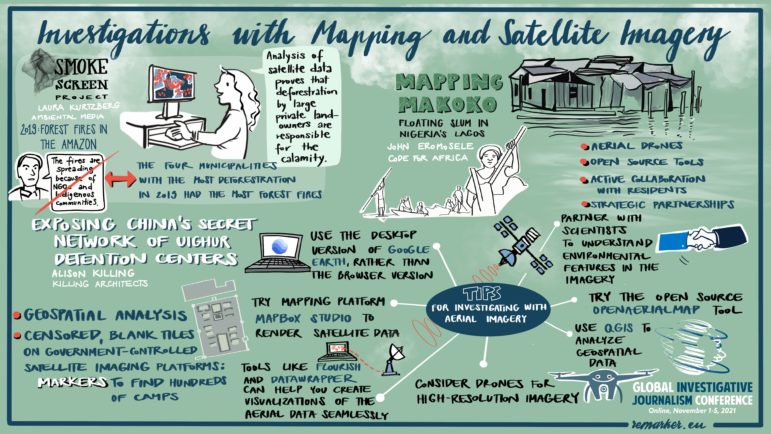
How to Expose Lies from the Skies Using Satellites and Drones
In a GIJC21 session on using maps and satellite imagery for investigations, three experts explained their approaches to analyzing satellite and drone images, and using open source tools. One of the innovative techniques described led to a Pulitzer Prize this year — for exposing China’s network of Muslim detention centers — while another exposed government deception about fires in the Amazon, and a third literally put a vulnerable community in Africa on the map.
Reporting Tools & Tips
My Favorite Tools: Geo-Journalist Gustavo Faleiros
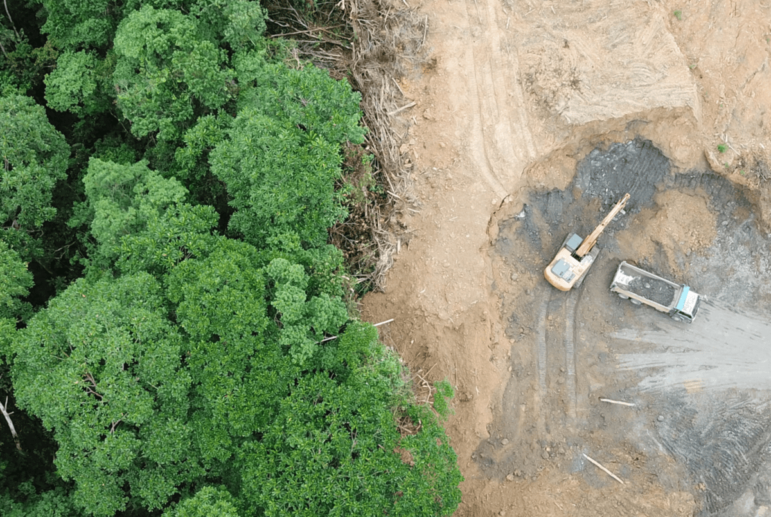
For our “My Favorite Tools” series, we spoke with Brazilian journalist Gustavo Faleiros, editor of environmental investigations at the Pulitzer Center where he leads the Rainforest Investigations Network (RIN), about mapping deforestation and using data to chart what is happening in global forests.
Reporting Tools & Tips
My Favorite Tools with BuzzFeed’s Craig Silverman
For our series about journalists’ favorite tools, we spoke with Craig Silverman, who leads a global beat on misinformation and media manipulation for BuzzFeed News. An author and award-winning journalist, Silverman shared some his top open source tools for digital investigations and for probing disinformation.
Reporting Tools & Tips
GIJN Masterclass with Paul Myers: Online Research Tips for Digging into the Pandemic and Beyond
In a GIJN masterclass webinar presented to 700 journalists from 94 countries, BBC internet research expert Paul Myers described the open source tools, syntax tricks, and search techniques that can help unearth elusive content, images, and social media posts. Myers cited searches for information on COVID-19 in numerous examples, and stressed the need for logical thought in order to unlock the power of advanced search tools.