
GIJN’s Data Journalism Top 10: Dealing Brexit, Following the Money, Swiss Greens, and a Kyrgyz Park Scam
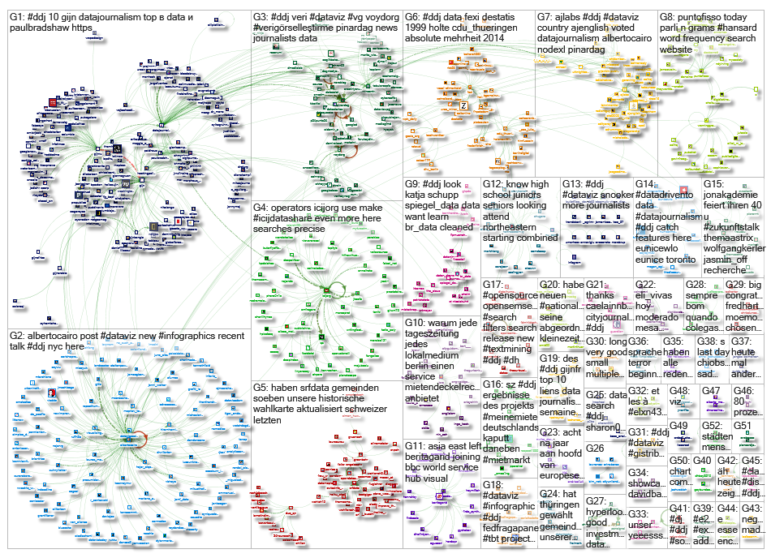
What’s the global data journalism community tweeting about this week? Our NodeXL #ddj mapping from October 21 to 27 finds a panel of leading data visualization practitioners discussing the practice of visualization in an age of disinformation, Kloop exposing how Kyrgyzstani officials privatized large swaths of a public park with no oversight, and The Guardian highlighting the minimal changes between ex-British Prime Minister Theresa May’s Brexit deal with current PM Boris Johnson’s new deal.
Decoding Dataviz
The Urban Institute hosted an evening dedicated to understanding data and visuals, where data visualization expert Alberto Cairo delivered a presentation on how to fact-check charts and visuals. It was followed by a panel discussion with leading data viz practitioners who spoke about the responsibility of creating charts, thoughtful representation of people in data points, being transparent about mistakes, and more.
Digital Partisanship
Using data-science software Graphext, Sky News analyzed the follower networks of British members of parliament. It discovered that their relationships on the social media platform are just as partisan as those displayed in parliament, with almost half the MPs following 10 or fewer colleagues from other political parties.
Sorting Data via Machine Learning
As datasets become larger and more complex, journalists are increasingly using machine learning models to help sort through and analyze the mass of data. “We have not even scratched the surface on ways that we can use machine learning systems to help solve our problems,” Quartz’s investigations editor John Keefe said.
Following the Money
Are you following financial trails for your story? Datajournalism.com gathered some inspiration for your investigations in its October newsletter, including a look at Dutch home care companies, money laundering in Montreal’s real estate market, and VAT fraud in Europe.
Public Park Privatized
Between 2000 and 2008, authorities in the Central Asian nation of Kyrgyzstan handed out parcels of land in Ataturk Park — once known as “the people’s park” — to 173 wealthy and well-connected people. There was no oversight or public explanation. Kloop spent a year filing more than 60 information requests and reviewing thousands of pages of decrees, court records, and other government documents to find out whose hands the park land fell into. The investigation is published in English and in Russian.
Brexit “New” Deal?
How different is the new Brexit deal presented by British Prime Minister Boris Johnson compared to the one earlier put forward by his predecessor Theresa May? The Guardian analyzed the deals and finds less than 5% was changed, and pinpoints exactly which parts of the original 293-page withdrawal agreement were renegotiated or removed.
https://twitter.com/MartinBelam/status/1185508712661864448
Who Owns Berlin’s Boxi?
As part of a university course, five students from the University of Applied Sciences in Potsdam spent half a year digging into archives and researching Berlin’s Boxhagener Platz (also known as Boxi) to find out the ownership structures of the houses in the square. Their project was further developed and reviewed by the Tagesspiegel Innovation Lab. Among their findings, thirteen houses (57%) in the square belong to individuals who acquired the buildings in the 1990s and have kept them ever since.
https://twitter.com/KatyDerbyshire/status/1187708072367661056
Gender Parity in German Lecture Halls
Men have often opted for more technical subjects while women leaned towards pedagogy. Does that stereotype still hold true? Zeit Campus analyzed the course enrollment data of first-year undergraduates in German universities and found a higher proportion of women in traditionally male-dominated courses.
https://twitter.com/fexi/status/1186643871033282560
Mental Health Sick Leave
Using data obtained through a Freedom of Information request from 57 fire, police, and ambulance services in England, Wales, and Northern Ireland, BBC analyzed and reported that the number of emergency service staff taking sick leave due to poor mental health had risen by a third between 2014 and 2018. Data on Github.
https://twitter.com/CharLewCole/status/1184465401100558336
Switzerland’s Green “Tsunami”
The magnitude of the votes surge for Switzerland’s Green parties in the recent parliamentary elections has been so surprising that party leaders have called it “not a green wave” but a “tsunami.” The newspaper 24 heures mapped where exactly the green parties have triumphed. Here’s another take on the green gains by SRF.
Thanks, once again, to Marc Smith of Connected Action for gathering the links and graphing them. The Top Ten #ddj list is curated weekly.
 Eunice Au is GIJN’s program coordinator. Previously, she was a Malaysia correspondent for Singapore’s The Straits Times, and a journalist at the New Straits Times. She has also written for The Sun, Malaysian Today, and Madam Chair.
For a look at Marc Smith’s mapping on #ddj on Twitter, check out this map.

Free, Game-Changing Data Extraction Tools that Require No Coding Skills

Basic Data Journalism Tips for Editors

My Favorite Tools: Venezuela’s Lisseth Boon on Design and Data Visualization

Document of the Day: Visual Vocabulary

From Space to Story in Data Journalism

Investigating India: How Smaller, Independent News Outlets Are Digging into Politics in a Key Election Year

10 Outstanding Data Projects Win the 2024 Sigma Awards

Trump’s Disappearing Donors, Tracking the Mars Rover, and the Ongoing Wars in Gaza and Ukraine

This work is licensed under a Creative Commons Attribution-NoDerivatives 4.0 International License
Republish our articles for free, online or in print, under a Creative Commons license.
Republish this article
This work is licensed under a Creative Commons Attribution-NoDerivatives 4.0 International License
Read Next
Data Journalism News & Analysis
From Space to Story in Data Journalism
Over the past 10 years satellite imagery has become an important component of data journalism. In the next 10, it will likely evolve further, from a tool used primarily for illustrating stories to an integral part of research and investigative reporting.
Data Journalism Investigating Institutions News & Analysis
Investigating India: How Smaller, Independent News Outlets Are Digging into Politics in a Key Election Year
Smaller investigative news outlets in India have been finding ways to do the most challenging and impactful accountability reporting leading up to the country’s key parliamentary elections in 2024.
Data Journalism
10 Outstanding Data Projects Win the 2024 Sigma Awards
There were 52 data journalism entries from 22 countries in shortlist for the 2024 Sigma Awards. Here are the top 10 winning projects.
Data Journalism Data Journalism Top 10
Trump’s Disappearing Donors, Tracking the Mars Rover, and the Ongoing Wars in Gaza and Ukraine
Our column of the best in data journalism also features stories on AI’s ability to forecast the weather, analyzing the Argentine president’s Tweetstorms, and apathetic EU voters.