GIJN’s Data Journalism Top 10: Moscow Garbage, Mexican Homicide, EU Ideologies
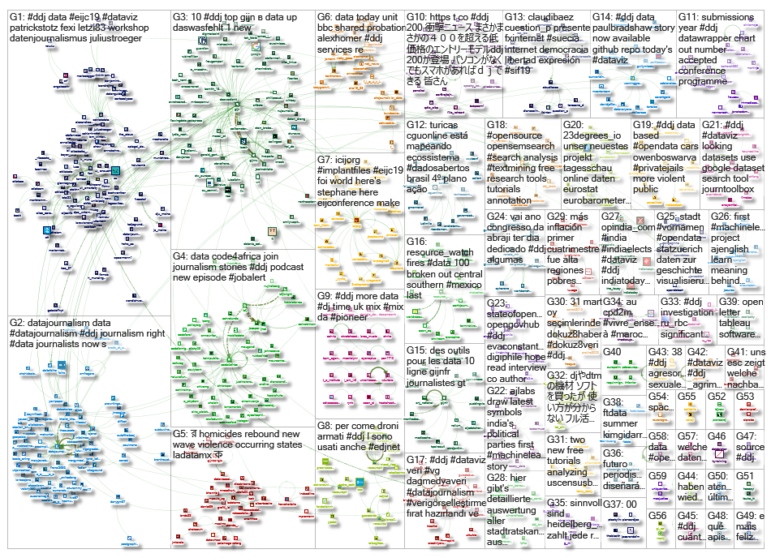
What’s the global data journalism community tweeting about this week? Our NodeXL #ddj mapping from May 13 to 19 finds a preview on sensible charts from @albertocairo‘s upcoming book “How Charts Lie,” @ladatamx‘s report on homicides in Mexico, @RepublikMagazin‘s analysis on the changing ideologies of political parties in the European Union, and a recap of the Data Journalism UK conference by @paulbradshaw.
Sensible Charts
Should all chart baselines start at zero? In a sneak peek of Alberto Cairo’s upcoming book “How Charts Lie,” he critiques charts that mislead readers by using scales and baselines that aren’t sensible.
Freedom to Kill in Mexico?
Mexico’s La Data published an analysis about the rebound in homicides in Mexico and visualized the murder rate month by month, state by state. The highest murder rate used to be in 2011, but violence started escalating in 2015, and in 2017 it outweighed the homicide rates of 2011.
EU Nations’ Changing Ideologies
Switzerland’s Republik magazine takes a look at the European Union in the last fifteen years and analyzes how and why the ideologies of the political parties in each country and their stance on the EU has changed over time.
Data Journalism UK Recap
“A journalist without data skills is handicapping themselves,” Reach’s David Ottewell said during the recent Data Journalism UK conference. In this great recap of the conference by Paul Bradshaw, the positive impact of data journalism and its ability to better inform journalists’ investigations is truly evident.
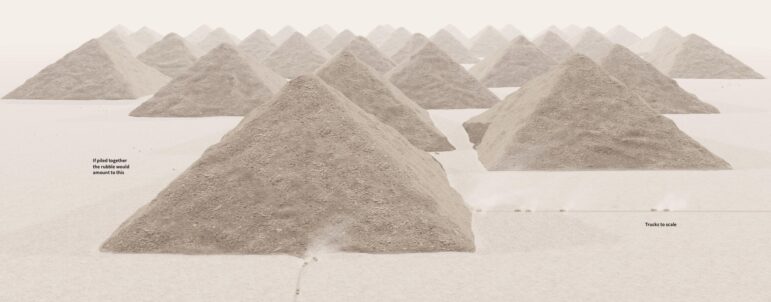
Growing Garbage in Moscow
RBC.ru gives an extensive overview of the growth of 23 garbage landfills in the Moscow region, using archival satellite images from Google Earth. The team estimated the size of the landfills using data from Russia’s Federal Service for State Registration, Cadastre and Cartography and through calculations using Google Earth.
Need for More Rigorous DDJ
Data journalism might have advanced and improved over the last decade but data, tech and science journalist Elisabetta Tola is disappointed in many of its practices and routines. She says in this piece that she sees data often being used in a decorative way — a nice map or infographic to fill a page, lacking context and giving people little means to go deeper on the issues.
https://twitter.com/fexi/status/1128286338510229505
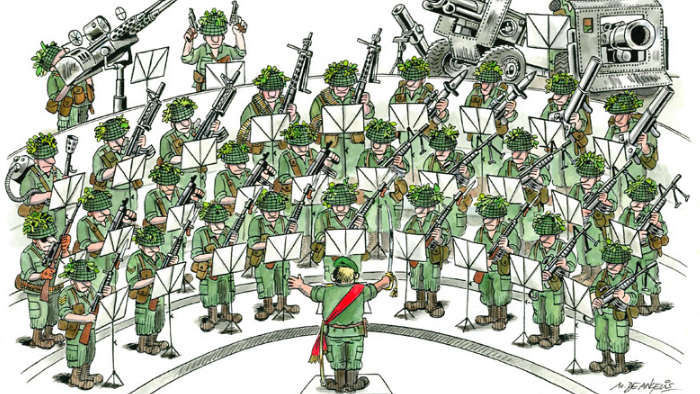
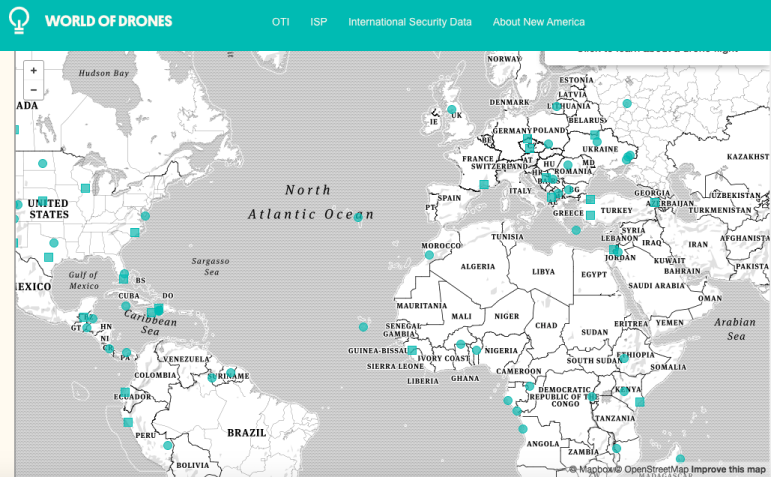
Armed Drones?
VoxEurop has a story that visualizes how the European Union has been contributing funds for drone research. But whether the drones will be used for civil or military actions remains a debate.
Analyzing Election Data
The South Africa general election was held earlier this month. Hacks/Hackers Johannesburg is organizing a two-hour meetup to dive into the election data in an attempt to find stories that news media might have missed so far.
ijnotes: The IJnet Podcast
IJNet — the invaluable media development news service — has produced its first podcast, ijnotes. In it, Korey Matthews interviews ICFJ Knight fellow Jacopo Ottaviani on data journalism. He speaks about visualizing data in an accessible way that can be understood by normal readership and the increasing trend of multi-disciplinary data teams.
Google Dataset Search
Software engineer Chris Gorgolewski, who has been working on Google Dataset Search, hosted an Ask Me Anything (AMA) session last week to answer questions on the search engine for publicly advertised datasets. Check the comment thread on Reddit for the Q&A.
Thanks, once again, to Marc Smith of Connected Action for gathering the links and graphing them. The Top Ten #ddj list is curated weekly.
 Eunice Au is GIJN’s program coordinator. Previously, she was a Malaysia correspondent for Singapore’s The Straits Times, and a journalist at the New Straits Times. She has also written for The Sun, Malaysian Today and Madam Chair.
For a look at Marc Smith’s mapping on #ddj on Twitter, check out this map.

Step-By-Step Guide for Journalists on the Basics of Google Sheets

Document of the Day: Visual Vocabulary

How To Create a Data Journalism Team
The Research Desk: Drones, Cool Tools, Green Companies
Step-By-Step Guide for Journalists on the Basics of Google Sheets

Lessons Learned: 10 Common Mistakes in Data Journalism
Airplane Accidents, 2024 Elections, Europe’s Lost Snowfall, and Recycling Movies
Data Journalism Top Ten: Turkey’s Toxic Rubble, Eurovision History, and a Rare Climate Victory

This work is licensed under a Creative Commons Attribution-NoDerivatives 4.0 International License
Republish our articles for free, online or in print, under a Creative Commons license.
Republish this article
This work is licensed under a Creative Commons Attribution-NoDerivatives 4.0 International License
Read Next
Data Journalism Reporting Tools & Tips
Step-By-Step Guide for Journalists on the Basics of Google Sheets
Knowing how to use spreadsheets is a crucial skill, as it allows you to find potential stories in large amounts of data and to think critically about how to use it.
Data Journalism News & Analysis
Lessons Learned: 10 Common Mistakes in Data Journalism
GIJN asked speakers and attendees in the NICAR conference hallways for the data journalism gaps they see and for under-covered topic areas newsrooms can address.
Data Journalism Data Journalism Top 10
Airplane Accidents, 2024 Elections, Europe’s Lost Snowfall, and Recycling Movies
With pieces on the global campaign landscape, airplane accidents, European snowfall, and the toll of the ongoing Israel-Hamas conflict in Gaza.
Data Journalism Data Journalism Top 10 News & Analysis
Data Journalism Top Ten: Turkey’s Toxic Rubble, Eurovision History, and a Rare Climate Victory
This week’s Top 10 Data Journalism stories curated by GIJN includes projects on Turkey’s toxic earthquake rubble, Eurovision song metrics, US migration from coastal cities, and world leaders’ heights.