Accessibility Settings

color options

monochrome muted color dark

reading tools

isolation ruler

Tag

twitter

28 posts

Data Journalism

Data Journalism Top 10: Russia’s Achilles’ Heel, Baby Names, Bike Shortage, Dataviz Color Guide

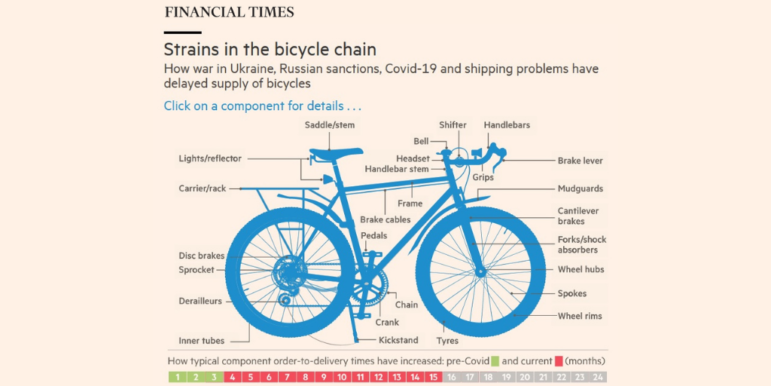
Our weekly look at some of the most popular data journalism stories on Twitter examines the logistical Achilles’ heel of the Russian invasion, ongoing gaps in the sanctions of Russian oligarchs, Europe’s selective support for refugees, a historical analysis of Scottish baby names, and a deep dive into how organizations should choose their data visualization color palettes.

The Guardian analyzes countries' climate change pledges

Data Journalism

Data Journalism Top 10: Toxic Air, Hidden Emissions, Twitter’s Algorithm, Can Data Die?

Our weekly analysis of the most popular data journalism stories on Twitter highlights a story by the Financial Times into how Europe gets its natural gas and the geopolitics of this industry. In this edition, we also feature major investigations into poisonous air and underreported methane emissions by ProPublica and The Washington Post as well as eight must-read newsletters curated by DataJournalism.com.

Data Journalism

Data Journalism Top 10: A New President, Trump’s Twitter Insults, Germany’s Elections, Flying Green

As Joe Biden was sworn in as the 46th president of the United States, much of the international media coverage was focused on an inauguration like no other. Our NodeXL #ddj mapping from January 18 to 24 found a Washington Post analysis of the president’s first address to the nation and a Bloomberg project visualizing the enhanced measures put in place to deal with concerns about security and the coronavirus.

Reporting Tools & Tips

Henk van Ess on Visual Thinking for Online Investigations

In a recent GIJN webinar, open source reporting expert Henk van Ess shared several online search tricks. But he explains that these work-arounds are merely tools for a new approach to online research that he calls “thinking visual,” which invites reporters to think of keywords like a search engine, rather than a person.

Reporting Tools & Tips

My Favorite Tools with Brazilian Journalist Sérgio Spagnuolo

For our series on journalists’ favorite tools, we spoke with Sérgio Spagnuolo, founder and editor of the Brazilian data journalism agency Volt Data Lab. He has worked on disinformation and data verification before founding Volt, an independent journalism agency focused on investigating, analyzing, and visualizing data.

Reporting Tools & Tips

GIJN Masterclass with Paul Myers: Online Research Tips for Digging into the Pandemic and Beyond

In a GIJN masterclass webinar presented to 700 journalists from 94 countries, BBC internet research expert Paul Myers described the open source tools, syntax tricks, and search techniques that can help unearth elusive content, images, and social media posts. Myers cited searches for information on COVID-19 in numerous examples, and stressed the need for logical thought in order to unlock the power of advanced search tools.

Data Journalism

GIJN’s Data Journalism Top 10: Trump’s Tweets, London’s Polluted Tube, Rising Seas, Data Voids

What’s the global data journalism community tweeting about this week? Our NodeXL #ddj mapping from November 4 to 11 finds The New York Times analyzing more than 11,000 of Trump’s tweets, The Financial Times measuring air quality in London’s Underground, Der Tagesspiegel creating an interactive of the Berlin Wall, and Nieman Lab discussing data voids exploited by media manipulators.

Reporting Tools & Tips

The Most Comprehensive TweetDeck Research Guide in Existence (Probably)

Do you know how to use TweetDeck to copy someone else’s Twitter list, then tailor it to your own needs? How about using it to search Instagram? Even if you’ve been using TweetDeck for years, you may still learn a trick or two from this comprehensive guide by Bellingcat investigator and trainer Charlotte Godart.