Accessibility Settings

color options

monochrome muted color dark

reading tools

isolation ruler

Tag

elections

58 posts

Data Journalism

GIJN’s Data Journalism Top 10: Dealing Brexit, Following the Money, Swiss Greens, and a Kyrgyz Park Scam

What’s the global data journalism community tweeting about this week? Our NodeXL #ddj mapping from October 21 to 27 finds a panel of leading data visualization practitioners discussing the practice of visualization in an age of disinformation, Kloop exposing how Kyrgyzstani authorities privatized large swaths of a public park with no oversight, and The Guardian highlighting the minimal changes between former British prime minister Theresa May’s Brexit deal with current PM Boris Johnson’s new deal.

Data Journalism

GIJN’s Data Journalism Top 10: 3D Animation, Brexit Borders, Bad Research, NY Subway

What’s the global data journalism community tweeting about this week? Our NodeXL #ddj mapping from September 2 to 8 finds Folha de São Paulo’s beautiful 3D animation of the Brazil National Museum’s restoration efforts, Guardian’s real-time visualization of Irish border crossings, NZZ’s look at China’s bad research impacting scientists worldwide, and The New York Times calculating the variability of New York City’s subway commute times.

Data Journalism

GIJN’s Data Journalism Top 10: Avengers on the Move, Nonprofit Tax Filings, Visualizing Uncertainty

What’s the global data journalism community tweeting about this week? Our NodeXL #ddj mapping from June 3 to 9 finds @sto3psl mapping places the Avengers visited in Europe, @fedfragapane visualizing which elements in the periodic table are in danger of running out, @srfdata highlighting the top worries of the Swiss and @propublica doing researchers and journalists a huge public service by making 3 million US nonprofit records text-searchable.

Data Journalism

GIJN’s Data Journalism Top 10: Game of Thrones Deaths, Visualizing Rich Hungarians, European Parliament

What’s the global data journalism community tweeting about this week? Our NodeXL #ddj mapping from May 20 to 26 finds @PostGraphics’ meticulous cataloguing of all on-screen deaths in Game of Thrones, @datajournalism’s tips on covering the crime beat, @DIEZEIT’s analysis of a politically diverse European parliament, and a quick beginner’s guide to learning data visualization by @AlliTorban.

Data Journalism

GIJN’s Data Journalism Top 10: Moscow Garbage, Mexican Homicide, EU Ideologies

What’s the global data journalism community tweeting about this week? Our NodeXL #ddj mapping from May 13 to 19 finds a preview snippet on sensible charts from @albertocairo’s upcoming book “How Charts Lie,” @ladatamx’s report on homicides in Mexico, @RepublikMagazin’s analysis on the changing ideologies of political parties in the European Union, and a recap of the Data Journalism UK conference by @paulbradshaw.

Data Journalism

GIJN’s Data Journalism Top 10: Data Feminism, Blockchain for Investigations, Train Speeds, EU DataViz Conference

What’s the global data journalism community tweeting about this week? Our NodeXL #ddj mapping from April 15 to 21 finds an informative interactive tool about the health of our generation by @srfdata, a piece by academic @wsaqaf explaining how journalism can utilize blockchain for investigations, data visualization teaching materials by @R_Graph_Gallery, and a book draft on data feminism by @kanarinka and @laurenfklein.

Data Journalism

GIJN’s Data Journalism Top 10: Number Jungles, Gender Gaps, Uber Maps, Brexit Woes

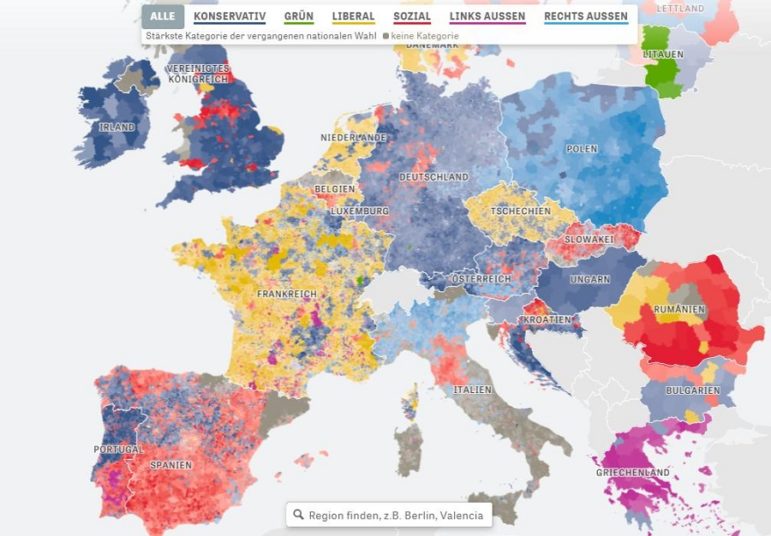
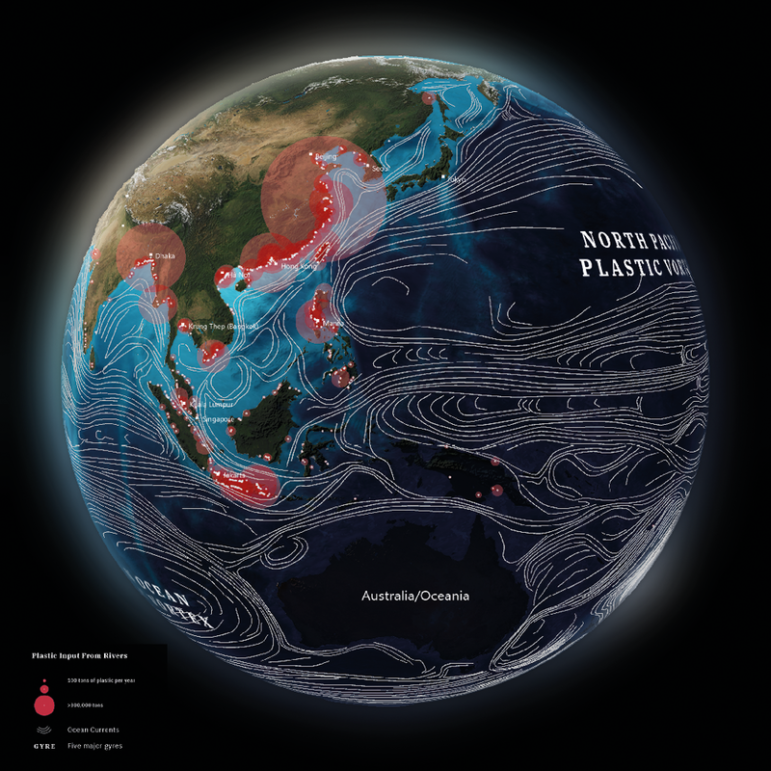
What’s the global data journalism community tweeting about this week? Our NodeXL #ddj mapping from November 5 to November 11 finds employment problems in the UK from @FinancialTimes, Polish data counter-narratives with @gazeta_wyborcza, cool geospatial analysis toys from @Uber, plus the launches of new data labs with @AlterEco_, data articles with @fstalph and @eborgesrey and data newsletters with @voydorg_en.

Data Journalism

Top Ten #DDJ: This Week’s Top Data Journalism

What’s the global #ddj community tweeting about? Our NodeXL mapping from July 3 to July 9 has @paulbradshaw with his top picks for data journalism stories for audio, @br_data and @BR_Recherche with a podcast on the tax paradise of Madeira and @EngnRoom with an introductory guide to investigative web research.