Accessibility Settings

color options

monochrome muted color dark

reading tools

isolation ruler

Tag

election

36 posts

Data Journalism

This Week’s Top Ten in Data Journalism

What’s the global data journalism community tweeting about this week? Our NodeXL #ddj mapping from October 9 to 15 has @RTSinfo looking into flight sharing platform @Wingly_UK, while @srfdata finds millions of fake @instagram followers, @jwyg charts the growth of all Internet sites, and @nytimes collaborates with @AmstatNews to promote critical thinking and data literacy.

Data Journalism

This Week’s Top Ten in Data Journalism

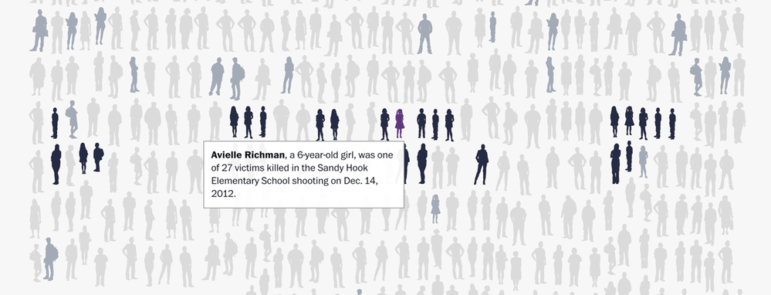
What’s the global data journalism community tweeting about this week? Our NodeXL #ddj mapping from October 2 to 8 has @source’s overview of two years of mass shooting visualizations in the US, @merbroussard’s callout for information to future-proof data stories and @paulbradshaw shares his four favorite computational thinking examples from @DailyMirror, @puddingviz, @BuzzFeed and @washingtonpost.

Data Journalism

This Week’s Top Ten in Data Journalism

What’s the global data journalism community tweeting about this week? Our NodeXL #ddj mapping from September 25 to October 1 has @FT mapping the route in a day of a London Uber driver, #NICAR18 registration opening up, @Lattif charting Africa’s internet shutdowns using @atlascharts and loads of German election data visualizations.

Data Journalism

This Week’s Top Ten in Data Journalism

What’s the global data journalism community tweeting about this week? Our NodeXL #ddj mapping from Sept. 18 to 24 features Wikipedia of Data Visualization, the State of Data Journalism, Dear Data Postcard Kit, and German election data.

Data Journalism

Data Journalism’s Top Ten

What’s the global data journalism community tweeting about this week? Our NodeXL #ddj mapping from Sept 11 to 17 has @puntofisso using machine learning to map the average face of British politicians, @AftertheFloodco creating a font that turns numbers into sparklines, and @datassist listing seven deadly sins in statistical analysis.

Data Journalism

Data Journalism’s Top Ten

What’s the global data journalism community tweeting about this week? Our NodeXL #ddj mapping from August 28 to Sept 3 has the most amusing memes you’ll read all day from  @xocasgv, a trip with @stuartathompson to the New York Times’ morgue to discover fascinating graphics from the 50s and 60s and crowdsourcing flooded roads by @HoustonChron.

Data Journalism

Data Journalism’s Top Ten

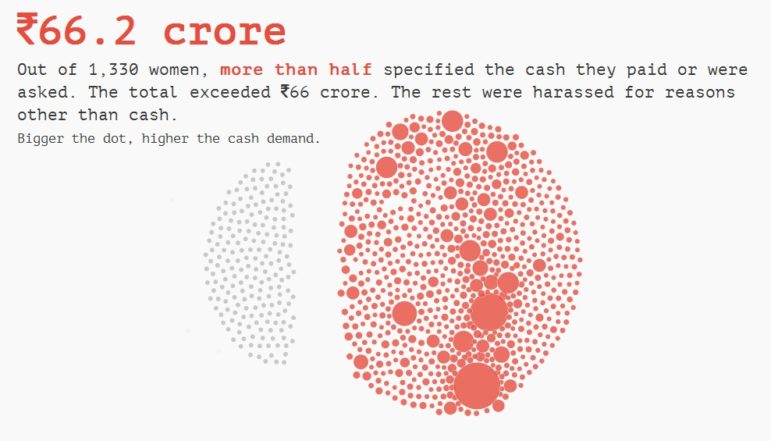
What’s the global data journalism community tweeting about this week? Our NodeXL #ddj mapping from August 21 to 27 has useful digital forensics tools from @bellingcat, mathematician Cathy O’Neil warning us about blind faith in big data and an analysis of Delhi’s insane dowry demands by @htTweets.

Data Journalism

Data Journalism’s Top Ten

What’s the global data journalism community tweeting about this week? Our NodeXL #ddj mapping from August 14 to 20 has @Forbes mapping six years of American television news, the looming Kantar @infobeautyaward’s submission deadline and @sarahslo’s list of women in the field of data visualization.

Data Journalism

Top Ten #ddj: This Week’s Top Data Journalism

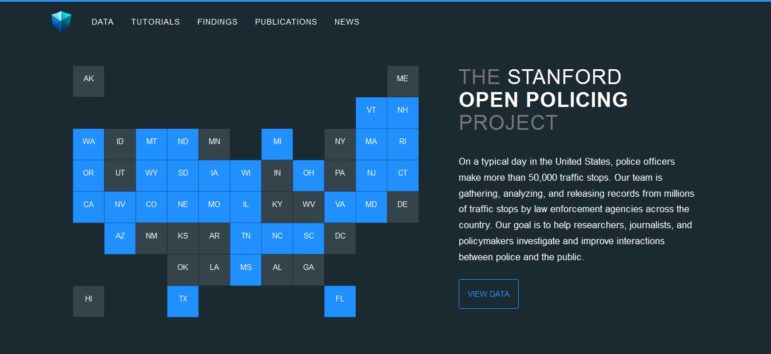
What’s the global #ddj community tweeting about? Our NodeXL mapping from June 19 to 25 includes Germany’s housing discrimination problem by @SPIEGELONLINE and @br_data, data on police interaction with the public from @StanfordEng and @StanfordJourn and a report on big data for gender from @Data2X.

Data Journalism

Top Ten #ddj: This Week’s Top Data Journalism

What’s the global #ddj community tweeting about? Our NodeXL mapping from June 5 to 11 includes #VisualTrumpery from @mcrosasb, analysis of Theresa May’s election disaster by @GuardianVisuals, dataviz structuring strategies from @eagereyes, and school enrollment woes in Delhi from @htTweets.